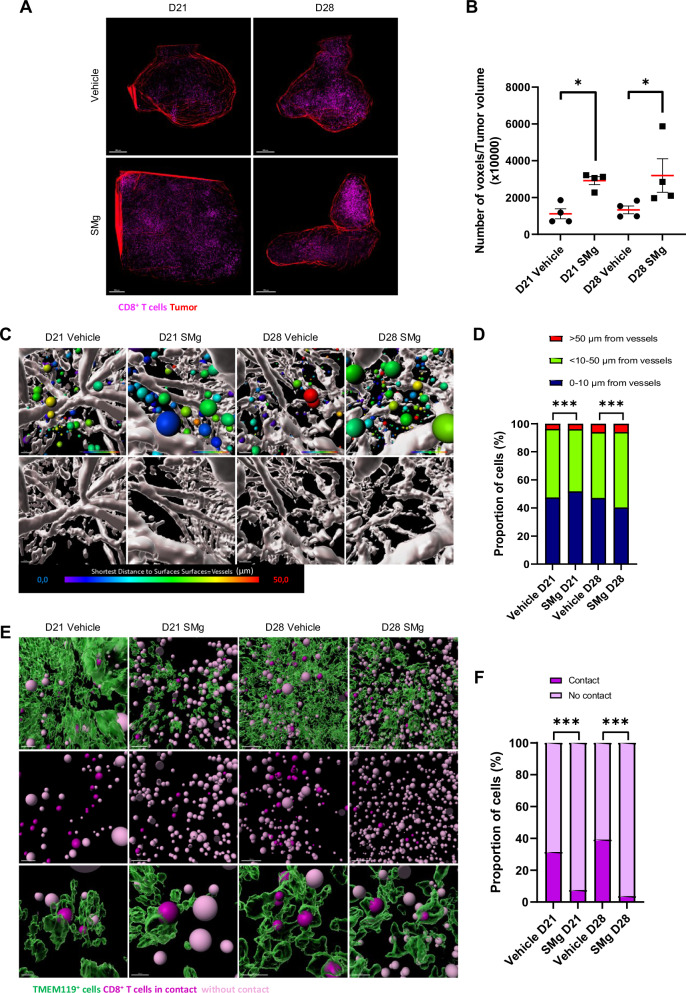
Fig. 7. SMg treatment decreases TAM-MG and CD8 T cell crosstalk.
A Representative 3D reconstitution of CD8+ T cells (purple) in GL261-DsRed tumor (red) at D21 and D28 upon vehicle and SMg treatment (scale bar = 500 µm). B Quantification of CD8+ T cell densities in vehicle and SMg-treated tumors at D21 (n = 4) and D28 (n = 4). Bar graphs represent mean ± s.e.m. Statistical analyses were performed by using Mann–Whitney test; alpha = 0.05, bilateral p-value: *p < 0.05. C Heat map representing the distance of CD8+ T cells from vessels at D21 and D28. Each CD8+ T cell is represented by one spot statistically coded by the shortest distance from vessels (heat map: from 0 µm to vessels in blue to > 50 µm in red). Representative images are shown. D Quantification of the distance of each CD8+ T cell from vessels. Each CD8+ T cells were classified in 3 categories according to their distance from vessels (1 = 0–10 µm, 2 = > 10–50 µm, 3 = > 50) at D21 (vehicle n = 21996, SMg n = 123,557) and D28 (vehicle n = 47952, SMg n = 47838). Data were normalized by 100% of total number of CD8+ T cells. Statistical analyses were performed by using the Khi² test; alpha=0.05, bilateral p-value: ***p < 0.0005). E 3D representation of cell contacts between TMEM119+ (green) and CD8+ T (purple) cells in tumor at D21 and D28 upon vehicle and SMg treatment (scale bar = 100 µm). Representative images of whole mount stainings are shown. F Quantification of the TMEM119+ cells in contact or not with the CD8+ T cells at D21 (vehicle n = 33,938, SMg n = 152,295) and D28 (vehicle n = 90176, SMg n = 63,458). Statistical analyses were performed by using the Khi² test; alpha = 0.05, bilateral p-value: ***p < 0.0005. A, C, E Acquisitions were performed by using 4× optical objective and 2.5× numeric zoom.

