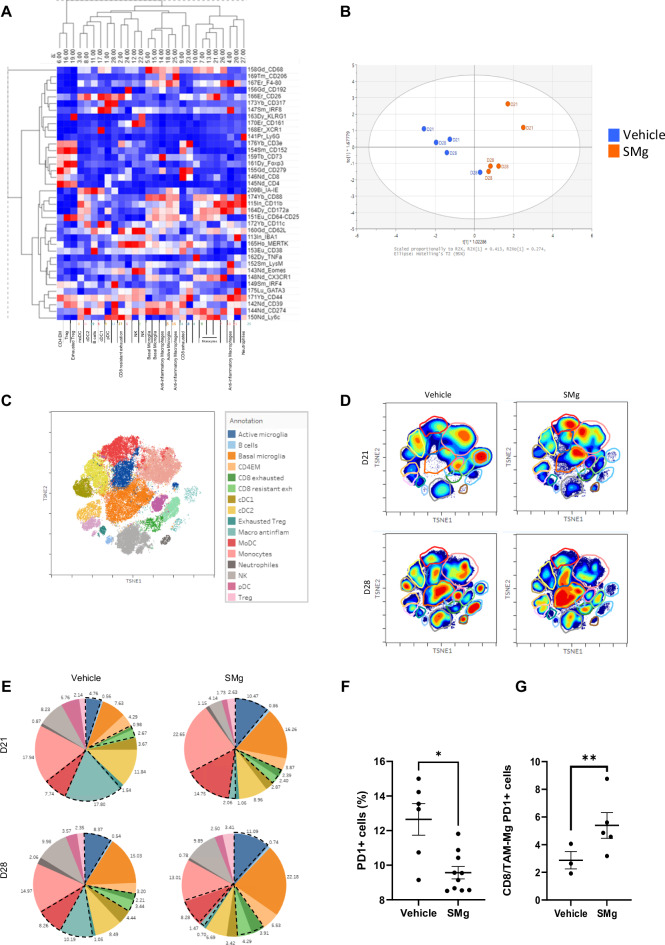
Fig. 8. SMg reshapes immune blood-derived cells and brain-resident immune cells.
A Heatmap representing the level of expression of each antigen in the different immune cell subsets. B Multivariate data analysis by SIMCA of vehicle (D21 n = 2, D28 n = 3) and SMg-treated (D21 n = 2, D28 n = 3) samples. C t-SNE unsupervised clustering of each immune population and annotated legend. D Heat map of the different immune cell clusters projected onto a t-SNE map for vehicle and SMg-treated tumors at D21 and D28. E Pie charts demonstrating the distribution of the identified immune cell subsets across conditions. The black dotted lines show the most affected immune cell subsets. F Percentage of TAM-MG expressing PD1 among the CD45+ cells (basal TAM-MG n = 8; active TAM-MG n = 8) upon vehicle or SMg treatment. The data from independent CYTOF experiments were pooled as well as those from D21 and D28 conditions. Statistical analyses were performed by using Mann-Whitney test; alpha = 0.05, bilateral p-value: *p < 0.05. G Ratio corresponding to CD8 total cells/TAM-MG expressing PD1 cells among the CD45+ cells upon vehicle or SMg treatment. The data from independent CYTOF experiments were pooled as well as D21 and D28 conditions (basal TAM-MG n = 22; active TAM-MG n = 22). Statistical analyses were performed by using Mann-Whitney test; alpha = 0.05, bilateral p-value: **p < 0.005. F, G Bar graphs represent mean ± s.e.m.

