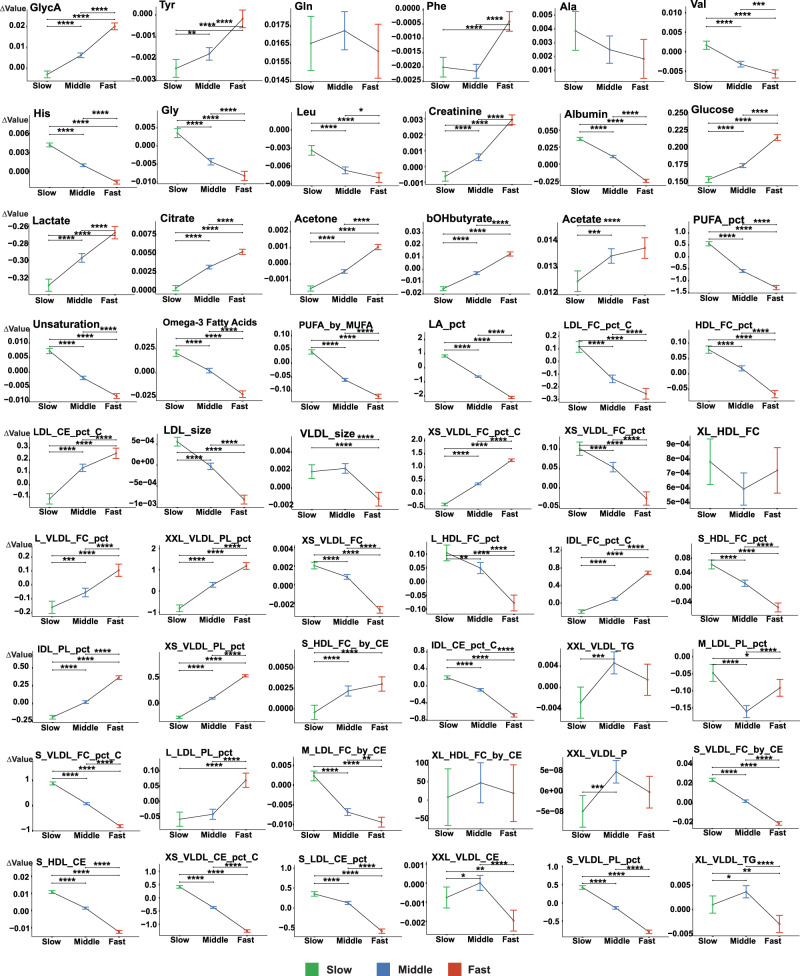
Fig. 7. Analysis of covariance comparing changes in each biomarker level against its baseline among the different metabolomic aging rate groups.
Changes in each biomarker level against the baseline (Δvalue) were compared between three aging rate groups using the Emmeans test with the baseline biomarker level adjusted as a covariate: top 25% (Fast, colored in red), middle 50% (Middle, colored in blue), and bottom 25% (Slow, colored in green) based on the distribution of the rate residuals regressed against the baseline metabolomic aging score. Two-sided P values from Emmeans tests are adjusted for multiple comparisons using the Benjamini–Hochberg (BH) procedure. Data were presented as estimated marginal means with 95% confidence intervals. *BH-adjusted P value <5E-02; **BH-adjusted P value <5E-03; ***BH-adjusted P value <5E-04; ****BH-adjusted P value <5E-05 (Exact P values are available in the corresponding Source Data file). The full name of each metabolomic biomarker is provided in Supplementary Data 1. The sample size for each NMR biomarker in the plot is 13,263. Source data are provided as a Source Data file.

