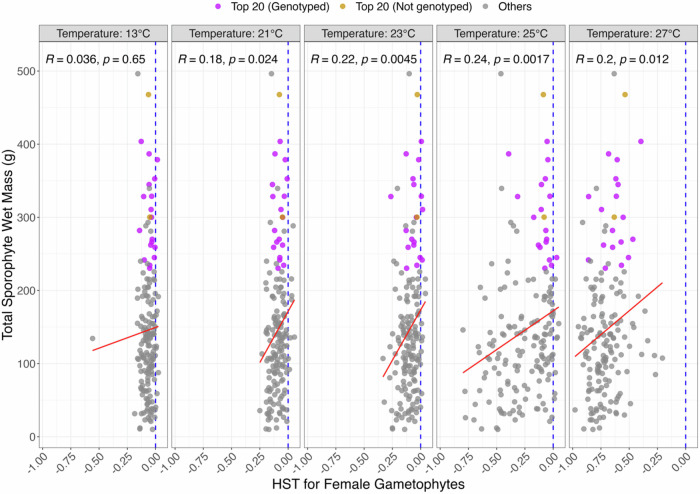
Fig. 1. Correlation analysis reveals a correspondence between sporophytes out-planted in warm water conditions offshore Santa Barbara, CA, and their parental female gametophytes heat-stressed in ex situ conditions.
Sporophytes were harvested in September 2019. The blue dotted lines show neutral response to heat stress (HST = 0), the red lines are linear regression between y- and x- axes. Gametophyte HST values plotted are averaged, normalized FI values from week 0-week 4 and correlated to sporophyte biomass. Correlations with P-values are placed on the top right corner (R and p, respectively).

