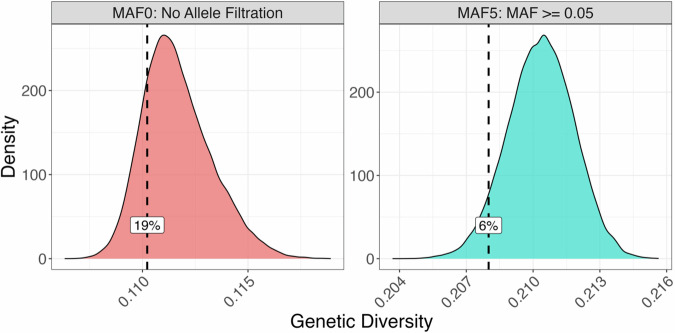
Fig. 2. Genetic diversity analysis reveals lower genetic variability in 18 heat stress-tolerant (HST) gametophytes in the context of 18 random gametophytes with the same population distribution.
Each panel represents the sampling distribution of genetic diversity (average pairwise Identity-by-State, GenDiv, (Eq. 5)) from 50,000 permutations. The observed GenDiv in the selected 18 HST female gametophytes is indicated by the dashed lines and corresponding percentile values. The left panel is based on the MAF0 SNP dataset, which includes all SNPs, while the right panel uses the MAF5 SNP dataset, where SNPs with minor allele frequencies less than 0.05 were removed.

