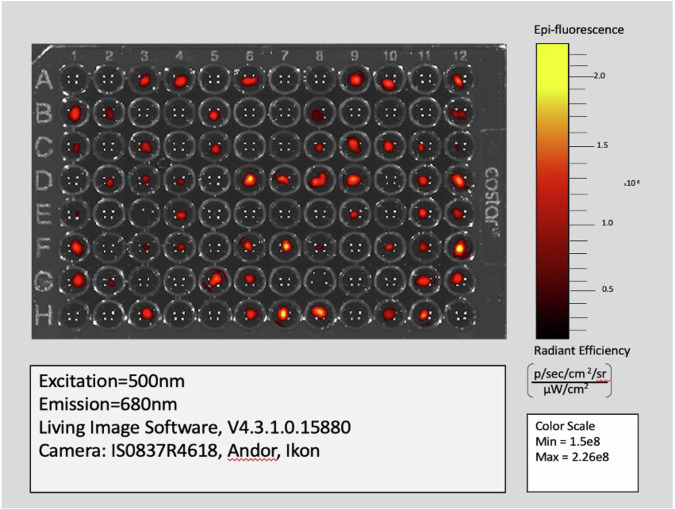
Fig. 3. Fluorescence imaging of giant kelp gametophytes at Week 0 using the IVIS 3D tomography system.
Only wells with visible red or yellow pixels contains a gametophyte. A 96-well plate containing the samples was positioned within the system with the imaging parameters set to emission 680 nm, excitation 500 nm, Epi-Illumination, Bin: (HR)4, FOV:13.2, F2, 2 s. Fluorescent intensity (FI) values were captured every 2 weeks over a period of four weeks, starting from Week 0, using LivingImage® software with a 12 × 8 grid. Data are presented in continuous fluorescent intensity units of [p/s] / [µW/cm²], allowing for the monitoring of changes in FI values per replicate throughout the thermal stress treatments.

