FIG. 7.
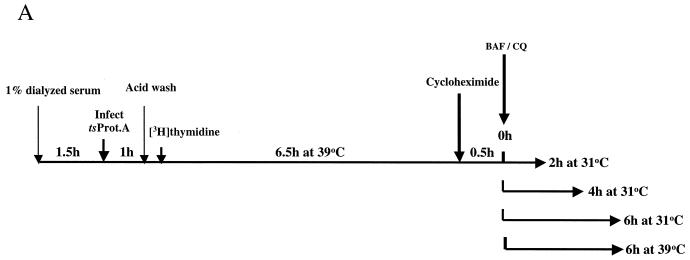
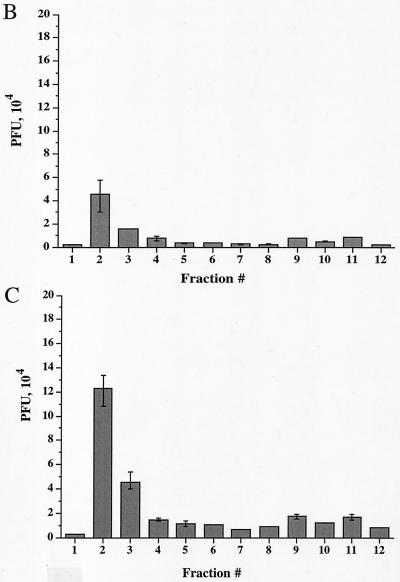
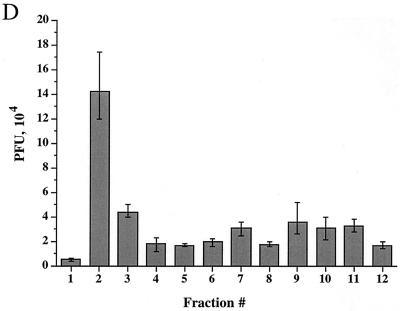
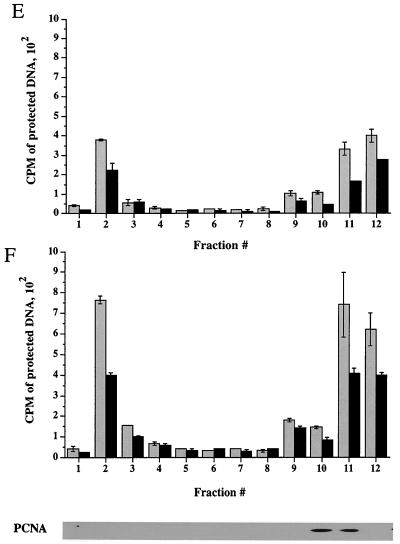
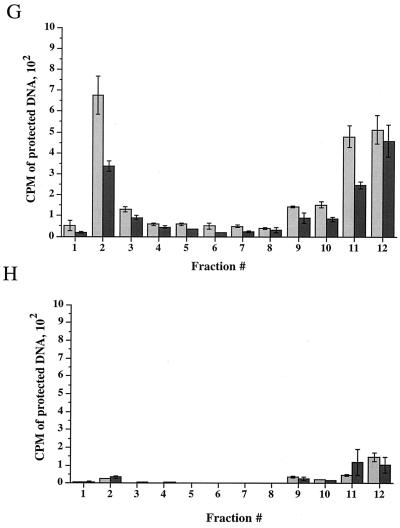
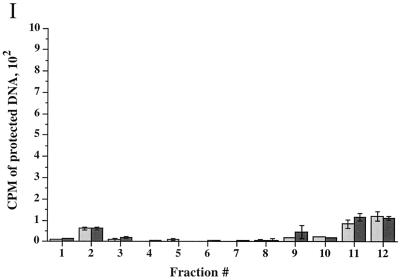
Time course of delivery of virus to cytoplasmic organelles. (A) Schematic showing the time course and conditions for this experiment. HuH7 cells were infected with tsProt.A and incubated for 7 h at 39°C in the presence of [3H]thymidine (cycloheximide was added 30 min prior to downshift). Cells were downshifted to 31°C for 0, 2, 4, or 6 h or kept at 39°C for a further 6 h. For each time point, a PNS was prepared and subjected to sucrose gradient centrifugation, and fractions were titrated for PFU. BAF/CQ indicates the time of addition of the drugs bafilomycin A1 and chloroquine in the experiments shown in Fig. 9. (B to D) PFU yields 2, 4 and 6 h after downshift, respectively. Fractions were also assayed for total packaged DNA (light bars) and enveloped DNA (dark bars) at 2, 4, 6, and 0 h after downshift to 31°C (panels E to H, respectively) or after an additional 6 h at 39°C (panel I). Plotted values are means of duplicates, and error bars indicate the range from the mean. An immunoblot for a nuclear marker, proliferating cell nuclear antigen (PCNA), was performed on fractions from a representative 4-h-downshifted gradient (F).

