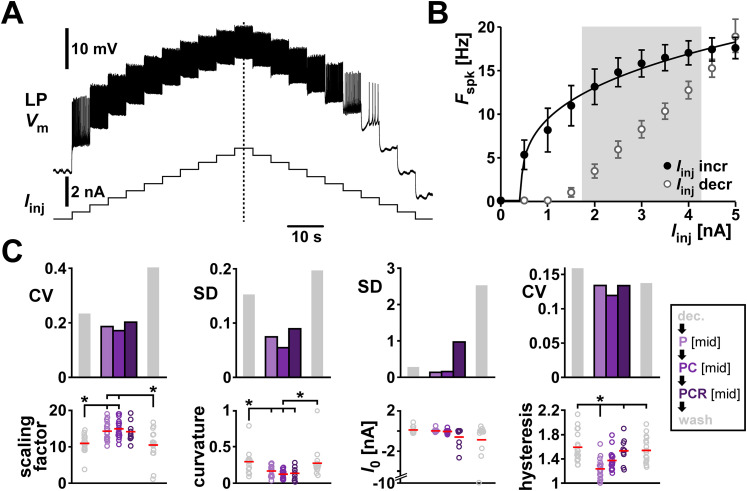
Figure 5.
Comodulation does not reduce the interindividual variability of excitability metrics on the single cell level. A, Voltage changes of one example LP neuron in response to increasing and decreasing current step. B, f–I curve of the experiment in A. The average spike frequency at each current level (dots and error bars indicate mean ± SD) was fitted with a power function (black line). To calculate f–I hysteresis between increasing (filled circles) and decreasing (open circles) levels of current steps, we divided the average spiking frequency in increasing by decreasing current levels between 2 and 4 nA (shaded area). C, Fit parameters (scaling factor = a, curvature = b in Eq. 1) and hysteresis with the corresponding metric of variability (CV, or SD for interval data) for different modulatory conditions (color coded). Dots represent values from individual experiments; horizontal bars indicate the mean values. Asterisks indicate pairwise significant differences between two groups or the group indicated with the longer line and those indicated with shorter lines. All other pairwise comparisons were not statistically significant. N = 19, except PCR N = 11. Statistical results are shown in Table 4. Total modulator concentration for [mid]: 1–3 × 10⁻⁸ M for P and PC, 3 × 10⁻⁸ M for PCR.

