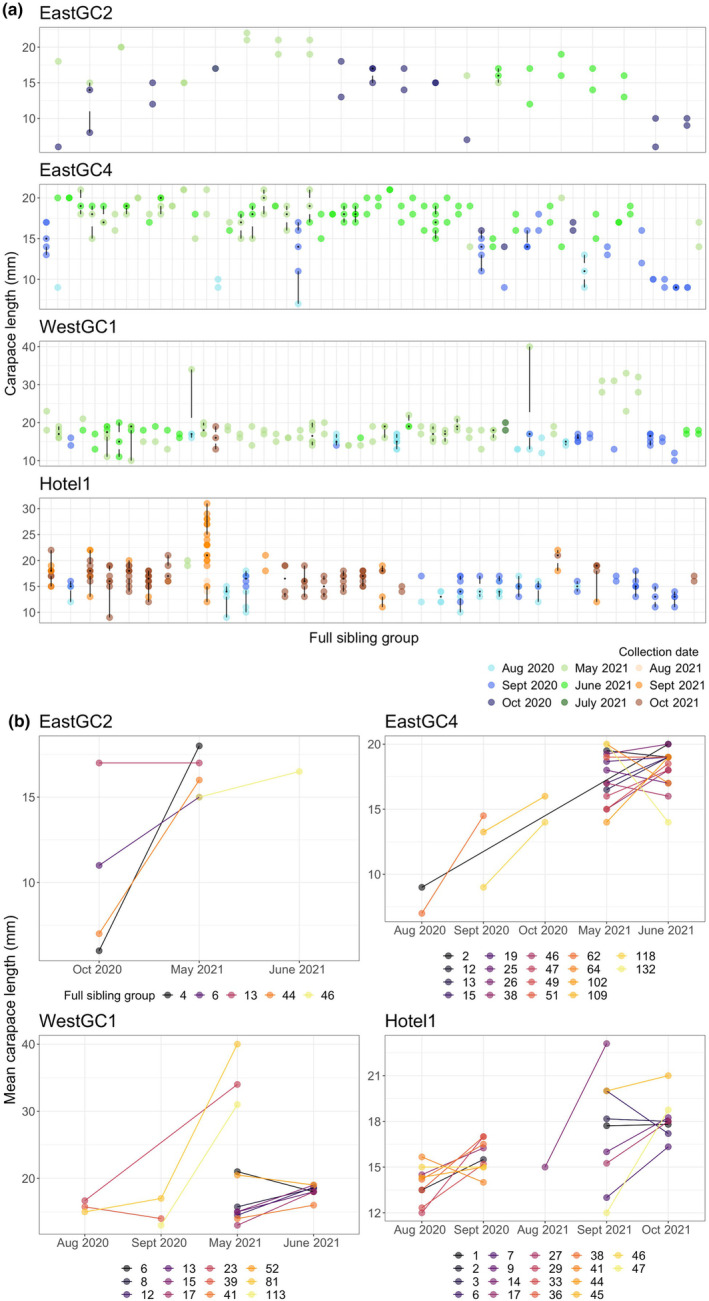
FIGURE 2.

(a) Modified boxplots of carapace length of inferred full‐sibling relationships among Procambarus clarkii juveniles collected from four sites (East Golf Course 2, East Golf Course 4, West Golf Course 1, and Hotel1) used to determine the number of juvenile cohorts present at each site. Black dots show the median carapace length, the white gap illustrates the interquartile range, and lines extend from the lower and upper quartiles to the minimum and maximum carapace length for each inferred family. Colored points show the month the individual was collected. Full‐sibling groups with a single individual were removed from the plots. (b) Mean carapace length (mm) of inferred full‐sibling juvenile groups that were collected over more than 1 month. Sibling relationships were estimated with Colony based on 930 single nucleotide polymorphisms (SNPs).
