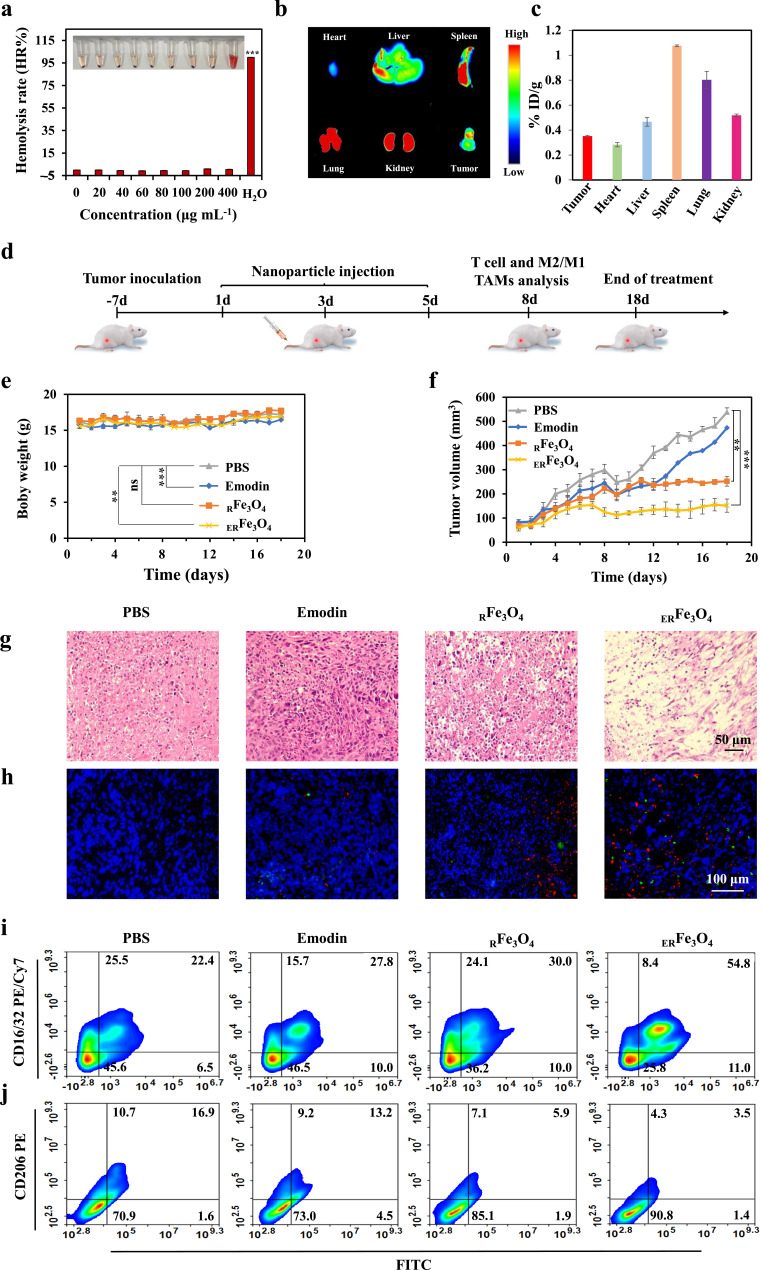
Figure 5.
In vivo evaluation of the anticancer and immunotherapeutic effects of ERFe3O4 NPs. (a) Digital photograph of hemolysis test and quantification of hemolysis rate (HR%) of ERFe3O4 NPs. (b) Fluorescence imaging of major organs and tumor 24 h post-injection of ERFe3O4 NPs. (c) The concentrations of Fe ions in mouse tissues and tumor were measured via ICP-MS analysis after 24 h administration of ERFe3O4 NPs. The results were presented as the percentage of the injected dose per gram of tissue (% ID/g). (d) Schematic diagram of timeline depicting the treatment process of PBS, emodin, RFe3O4 NPs, or ERFe3O4 NPs. (e) The body weight change of mouse during the treatment period. (f) Tumor growth curves were plotted for a 4T1 tumor-bearing mouse model treated with various nanoparticles (n = 6). (g) After 18 days of treatment, tumor tissue was stained using H&E. (h) Immunofluorescence stained of CD80 and CD86 in tumor tissue on the 8th day (Red: CD80. Green: CD86). (i and j) Flow cytometry was used to analyze the levels of CD16/32 and CD206 in F4/80+ macrophages within tumor tissues. In (a), (e), and (f), asterisks indicate statistical significance compared to the PBS group, as determined by one-way ANOVA with Tukey’s post-hoc analysis. ** p < 0.01, *** p < 0.001.

