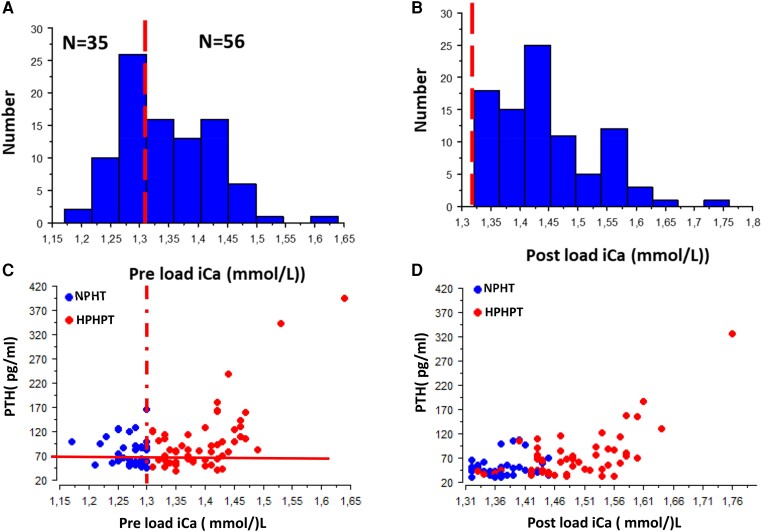
Figure 2.
Distribution of iCa in the studied population in a fasting state after (A) a calcium-restricted diet and (B) following a calcium load test. As shown, all patients experienced a postload iCa >1.31 mmol/L. Relationship between PTH and iCa (C) before and (D) after a calcium load test. Dotted lines represent the iCa normal upper limit. In (C) the solid line represents the serum PTH normal upper limit. In (D) the solid line represents serum the PTH upper limit in the context of hypercalcemia (see “Material and Methods”).

