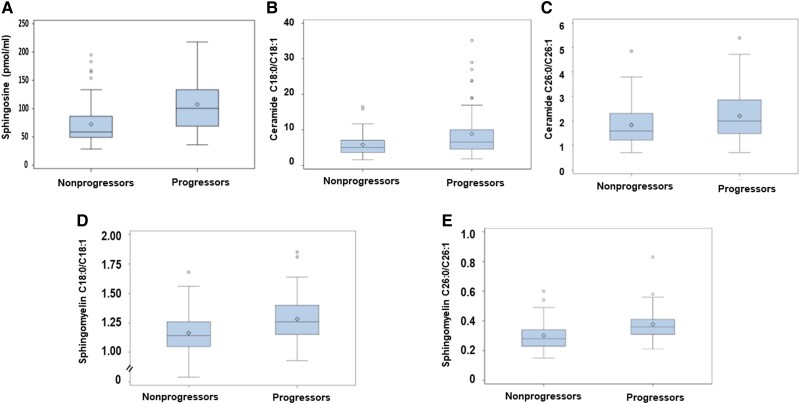
Figure 1.
Box-and-whisker plots of sphingosine levels (A) and the saturated-to-monounsaturated ratios of ceramides C18:0/C18:1 (B) and C26:0/C26:1(C) and sphingomyelins C18:0/C18:1 (D) and C26:0/C26:1 (E) in baseline plasma specimens obtained from participants who progressed from normoglycemia to prediabetes (progressors) and those who maintained normoglycemia (nonprogressors) during 5 years of follow-up. For each box-and-whisker plot, the diamond symbol inside the box represents the geometric mean, the horizontal line represents the median, the lower and upper ends of the box represent the 25th and 75th percentiles, respectively, and the whiskers represent the maximum or minimum values within 1.5 × the interquartile range. Progressors to prediabetes had significantly higher baseline ratios of the saturated-to-unsaturated ceramides and sphingomyelins compared with nonprogressors (P = .038-<.0001).

