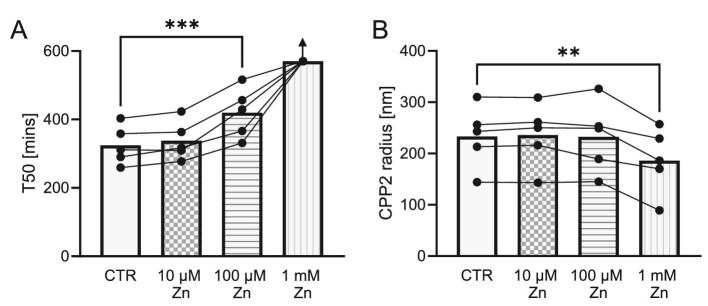
Figure 3:
T50 (A) and hydrodynamic radius of CPP2 (B) shown as mean (bars) with individual measurements depicted as dots in serum samples from healthy volunteers (n = 5) after addition of ZnCl2 (0–1000 µM). All T50 values for the 1 mM zinc group were above the measurement range of 570 min (indicated by arrow), and therefore excluded from statistical analysis (Dunnetts test vs CTR). **P < .01, ***P < .001.

