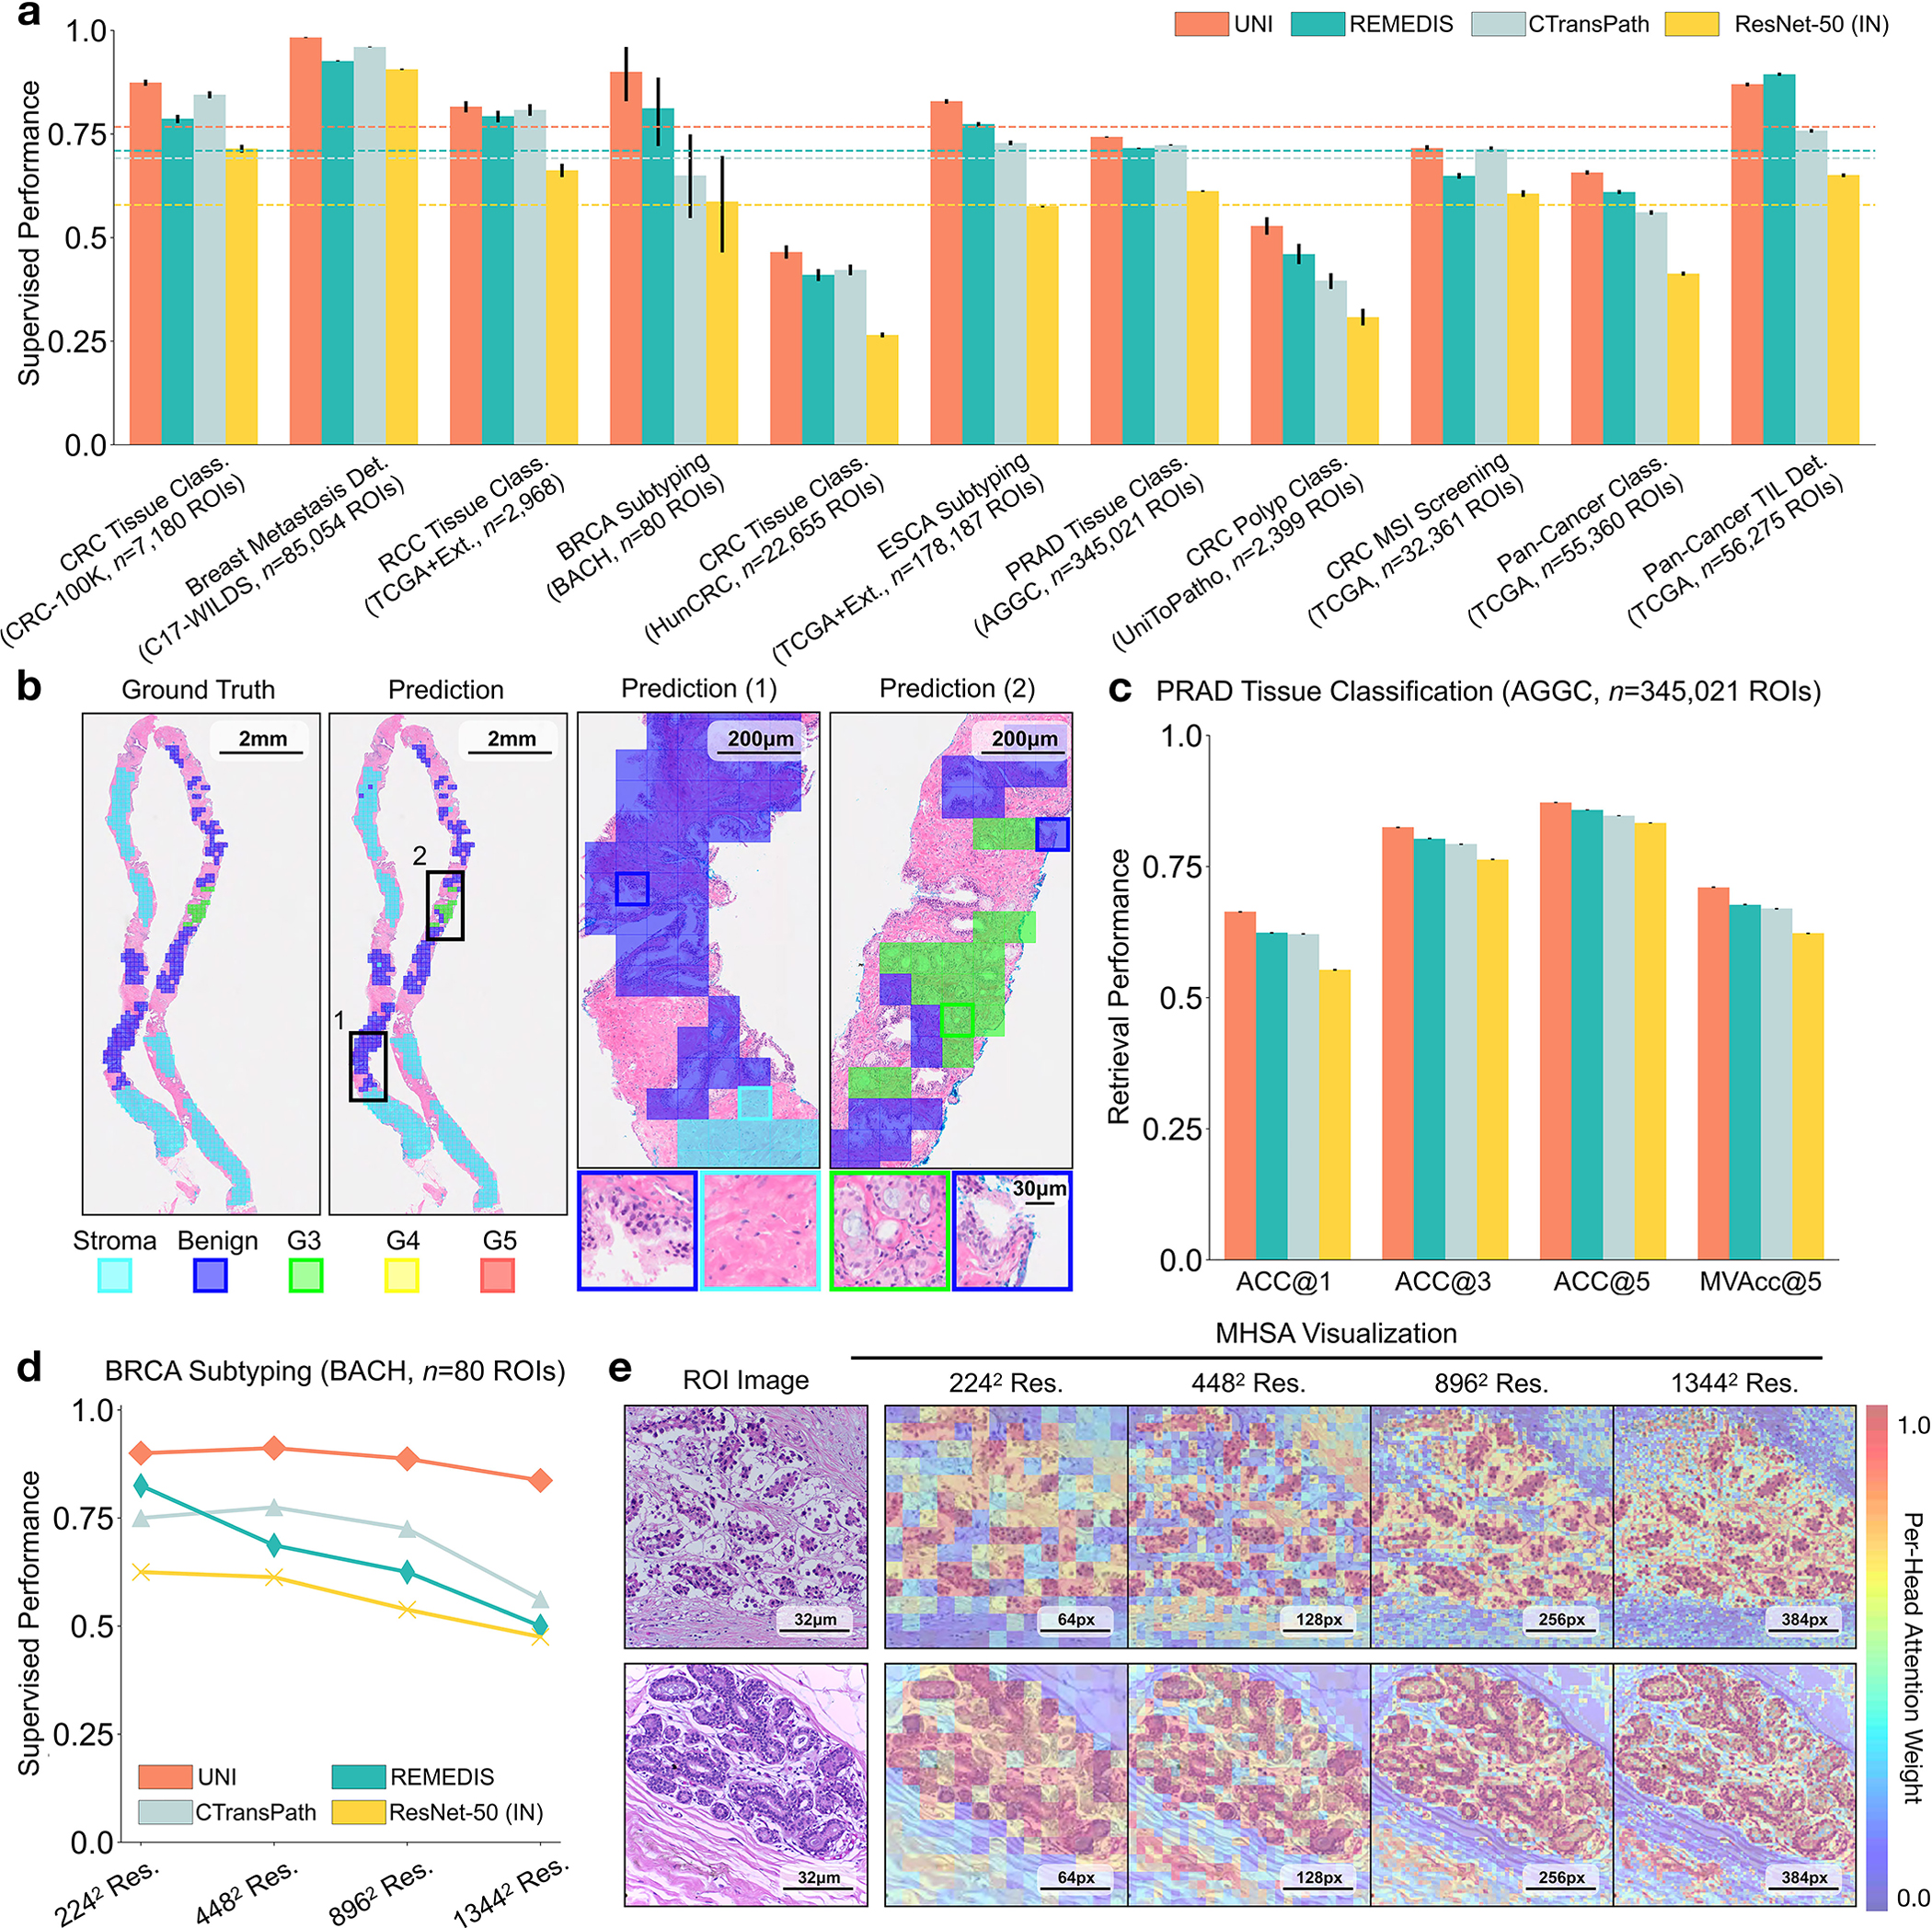
Fig. 3: ROI-level tasks.

a, Supervised linear probe performance of UNI and its comparisons across 11 ROI-level classification tasks. All results are given as balanced accuracy except for PRAD tissue classification, which is given as weighted F1 score. Dashed lines represent the average performance of each model across all tasks. Error bars represent 95% confidence intervals and the centers correspond to computed values of each metric as specified above. Detailed results for all tasks are provided in Supplementary Tables 39–60. b, Examples of UNI on ROI classification for PRAD tissue classification in AGGC. Left: ground-truth ROI- level labels overlaid on the WSI. Right: predicted patch labels. ROIs are enlarged for better visualization, with further comparisons shown in Extended Data Fig. 2. c, ROI retrieval performance of UNI on PRAD tissue classification (AGGC, n = 345,021 ROIs). We report Recall@K for K ∈ {1, 3, 5} and the mean recall, with error bars representing 95% confidence intervals and the centers corresponding to computed values of each metric. d, Supervised KNN probe performance of UNI across various image resolutions (res., in pixels) in BRCA subtyping in BACH (n = 80 ROIs). Retrieval performance for all tasks is provided in Extended Data Fig. 3 and Supplementary Tables 63–68. e, Multi-head self-attention (MHSA) heatmap visualization of UNI across different image resolutions (in pixels) in BACH. Each colored square represents a 16 × 16 pixel patch token encoded by UNI, with heatmap color corresponding to the attention weight of that patch token to the global [CLS] (that is, classification) token of the penultimate layer in UNI. Top and bottom, respectively: visualizations for the invasive- and normal-labeled images, with further visualizations and interpretations provided in Extended Data Figs. 4–6. Scale bars: b, ground truth and prediction, 2 mm; prediction(1) and prediction(2), 200 μm; insets, 30 μm; e, ROI image, 32 μm; 2242, 64 pixels; 4482, 128 pixels; 8962, 256 pixels; 1,3442, 384 pixels.
