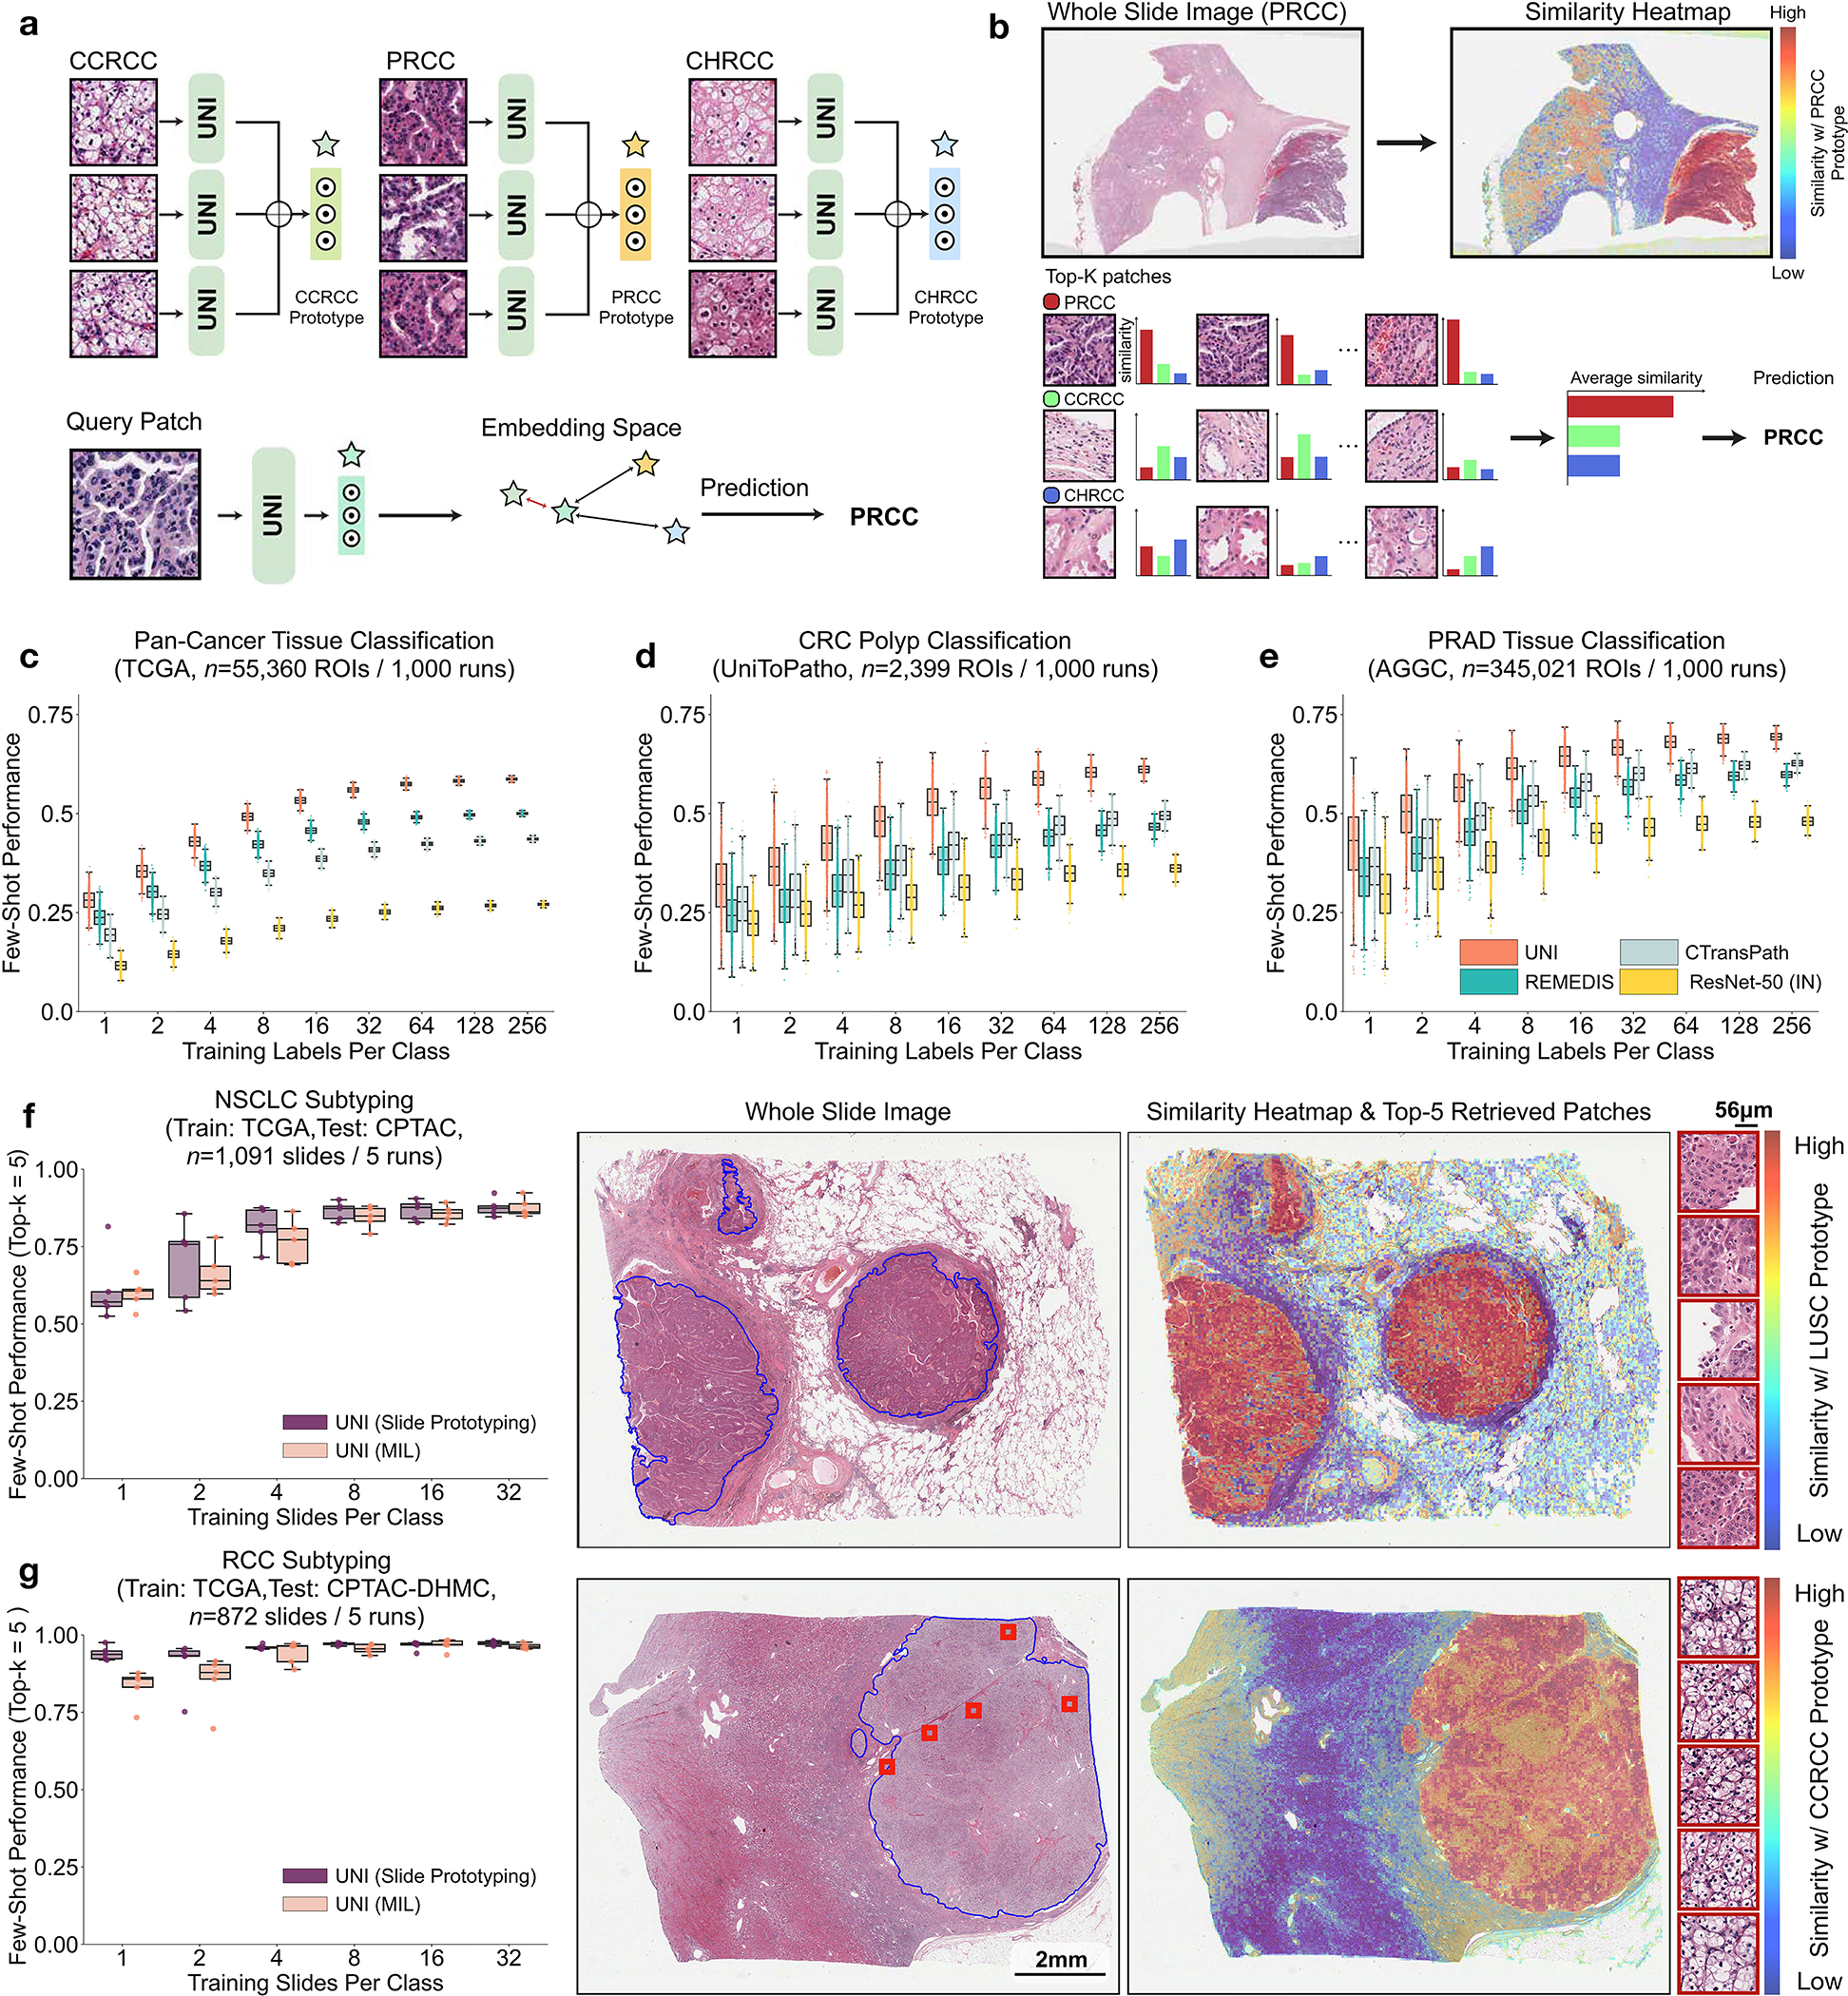
Fig. 4: Few-shot ROI- and slide-level prototyping.

a, Prototypical few-shot ROI classification via SimpleShot. A class prototype is constructed by averaging the extracted features from ROIs of the same class. For a test ROI, SimpleShot assigns the class of the most similar class prototype (smallest Euclidean distance) as the predicted ROI label. b, Prototypical few-shot slide classification via MI- SimpleShot. Using a pre-computed set of ROI-level class prototypes (sharing the same class labels as the slide), MI-SimpleShot predicts the slide label using the class prototype with the highest average similarity of top-K patches queried from the WSI. The similarity heatmap visualizes the similarity between the ground- truth class prototype and each patch in the WSI. c–e, Few-shot ROI classification performance via SimpleShot on three tasks, with boxes indicating quartiles of model performance (n = 1,000 runs) and whiskers extending to data points within 1.5-fold the interquartile range. c, Pan-cancer tissue classification (TCGA, n = 55,360 ROIs). d, CRC polyp classification (UniToPatho, n = 2,399 ROIs). e, PRAD tissue classification (AGGC, n = 345,021 ROIs). Few-shot ROI performances for all tasks are provided in Extended Data Fig. 8. f,g, Few-shot slide classification performance and similarity heatmaps via MI-SimpleShot for NSCLC subtyping (train, TCGA; test, CPTAC; n = 1,091 slides) (f) and RCC subtyping (train, TCGA; test, CPTAC-DHMC; n = 872 slides) (g). In both tasks, using pre-extracted features from UNI, we compare MI-SimpleShot in the same few-shot settings as ABMIL (boxes indicate quartile values of model performance with n = 5 runs and whiskers extend to data points within 1.5-fold the interquartile range), and visualize similarity heatmaps and the top-5 similar patches (indicated in red bounding boxes) for a LUSC (f) and CCRCC (g) slide. Scale bars: WSI, 2 mm; top-5 retrieved patches, 56 μm. Further details, comparisons and visualizations are provided in Methods and Extended Data Figs. 8–10.
