
Fig. 2.
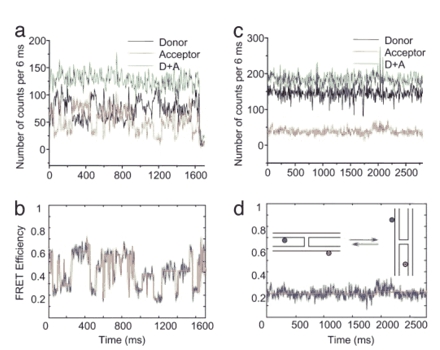
Time traces of the fluorescence intensities and FRET efficiencies of mobile and immobile HJs in 10 mM MgCl2 buffer. (a) The time dependences of single-molecule fluorescence intensities of donor (black), acceptor (red), and the summed intensity [donor plus acceptor (D+A), green] for the mobile HJ. Intensities are taken over a 6-ms binning interval. (b) The time dependence of the FRET efficiency (blue line) of the data shown in a. The red line is the result of an averaging procedure described in Methods, which better reveals plateaus. (c) Immobile HJ time traces of the single-molecule fluorescence intensities of the donor (black) and acceptor (red) and the summed intensity [donor plus acceptor (D+A), green]. (d) The time dependence of the FRET efficiency obtained from the data shown in c (blue line). (Inset) Two folded conformations of immobile HJ are shown schematically.