
Fig. 3.
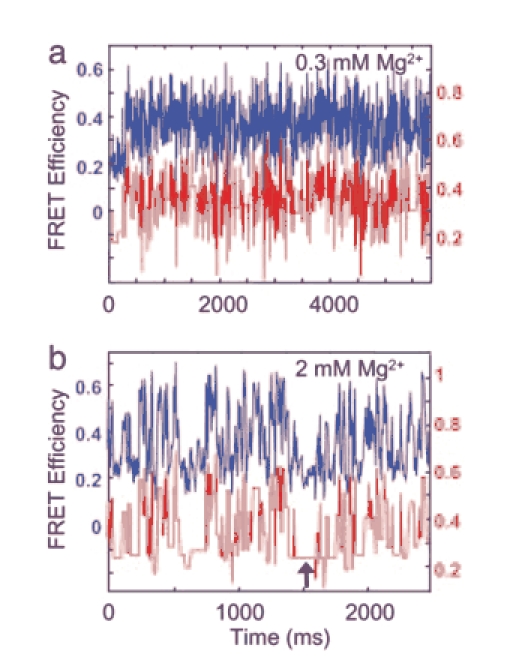
The spFRET data for mobile HJs obtained at different concentrations of Mg2+ cations. (a) Measured time dependence of the FRET efficiency in a 0.3 mM MgCl2 buffer (upper blue curve, left axis). Red line (shifted for clarity, right axis) shows the same data but averaged as described in Methods. (b) Time dependence of the FRET efficiency in a 2 mM MgCl2 buffer. Raw (blue) and averaged data (red) are presented as in a. All efficiency data were binned with 6-ms time intervals.