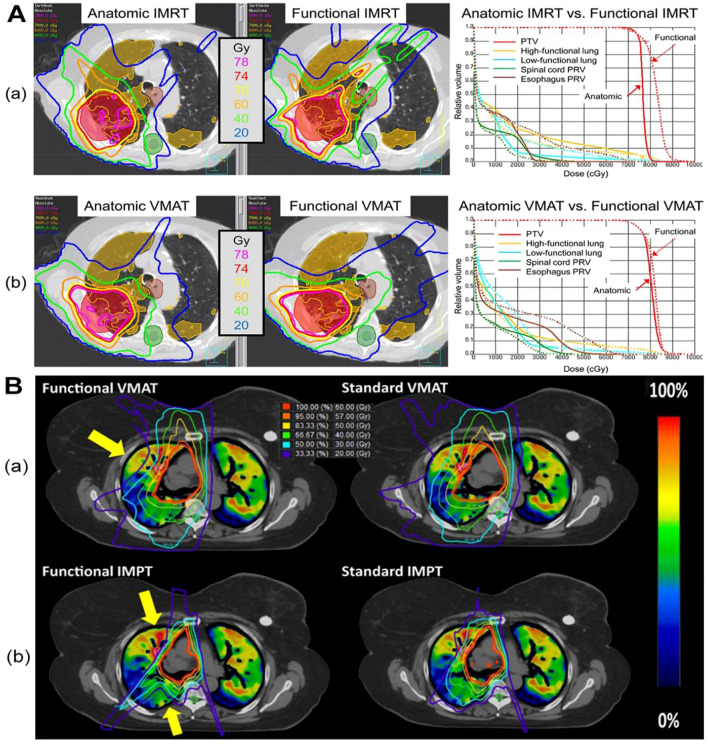
Figure 1.
The dose distribution in CTVI-based planning of photon and proton therapy respectively. Figure1 is the comparison of a functional avoidance plan and non-functional plan. The CT, CT-ventilation images, isodose lines, and PTV (shown in red) are presented for both groups of plans of photon (A) and proton (B) herapy. The arrows highlight the regions with the most prevalent functional lung sparing. A printed with permission from Yamamoto T, et al (25) and B printed with permission from Dougherty JM, et al (56).

