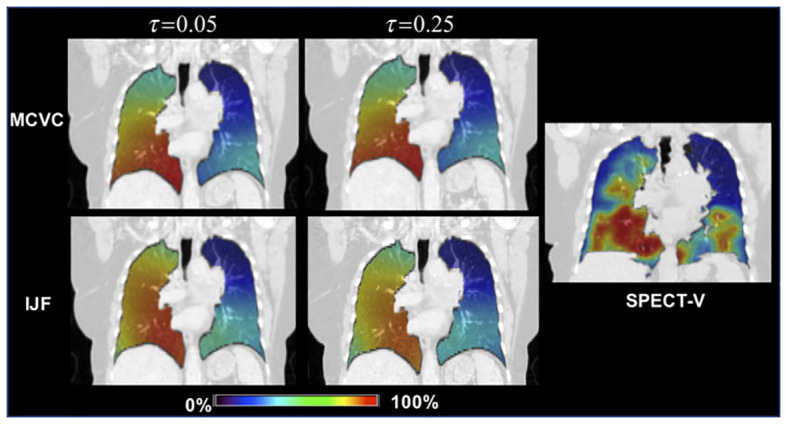
Figure 2.

The correlation between 4D-CT and SPECT images Top Row: The 4DCT‐Inhale phase (left) and SPECT (right) ventilation images for the case with the lowest over correlation . Bottom Row: The IJF (left) and MCVC (right) superimposed on the 4DCT‐Exhale phase. Ventilation images were converted to percentile images for direct visual comparison. printed with permission from Castillo E, et al (65).
