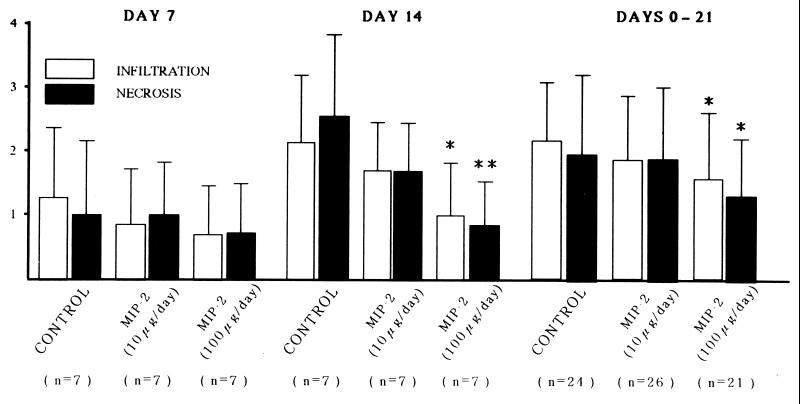
FIG. 4.
Pathological scores. The pathological scores of cellular infiltration and necrosis on day 14 and on days from 0 to 21 were less in the anti-MIP-2 group (100 μg/day treated) compared with those of the control. n indicates the number of mice sacrificed on days 7 and 14 in each group, and the 0- to 21-day group represents those animals used in Fig. 2. The pathological scores of cellular infiltration and necrosis on day 21 were also significantly less in group 3 (infiltration = 1.71 ± 0.92; P < 0.05; necrosis = 1.41 ± 0.80; P < 0.01; n = 17), but not in group 2 (infiltration = 2.27 ± 0.80; necrosis = 2.20 ± 1.08; n = 15), as compared with group 1 (infiltration = 2.50 ± 0.80; necrosis = 2.67 ± 0.98; n = 12). ∗ and ∗∗, P < 0.05 and P < 0.01, respectively, versus the control.

