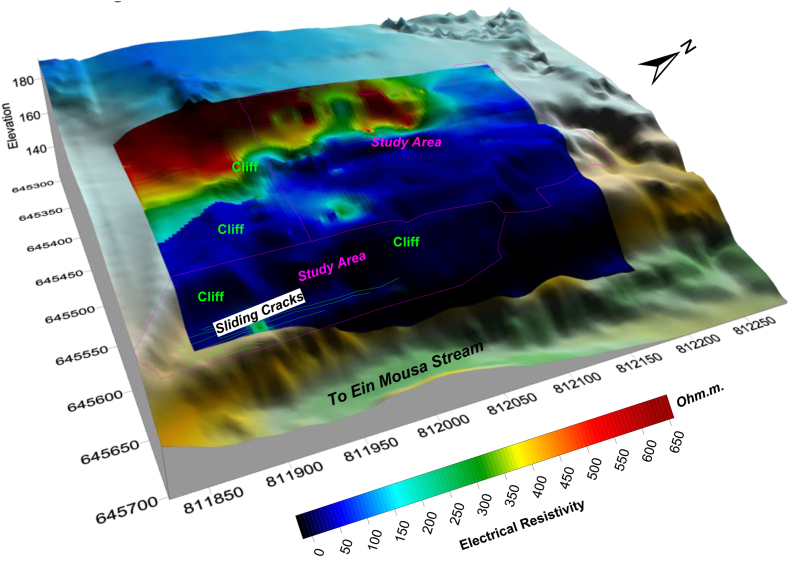
Fig. 25.
3D plot showed the variation of average electrical resistivity with slope obtained from ERT method [67] for about 30m depth for all 12 profiles described in Fig. 16, showed nearly the entire site is saturated with brackish water due to drainage of irrigation water of about 1–25 Ohm.m. While the highest electrical resistivity is about 650 Ω m at the Western part of the study area which is the highest part.

