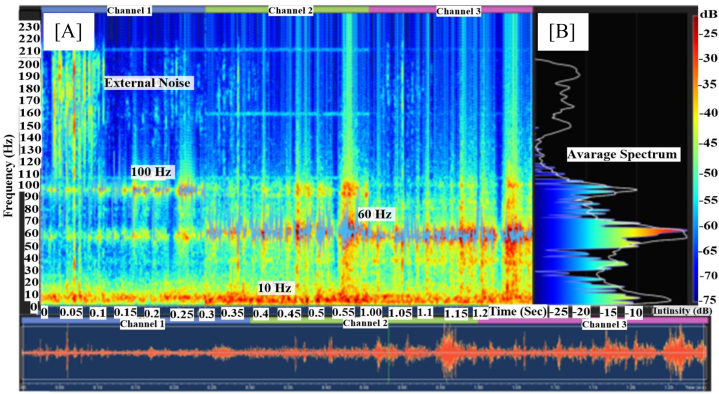
Fig. 33.
Spectrogram taken over the sliding area (S11 Fig. 18) showed a three resonance peaks at 10 Hz, 60 Hz and 100 Hz. [A] Spectrogram for sliding crushed clayey limestone and relatively high sound energy about 15 dB. [B] The corresponding average Fourier spectrum.

