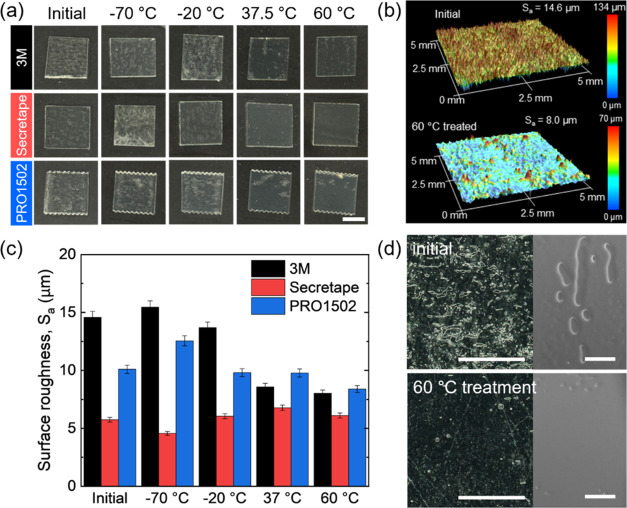
Figure 7.
(a) Photographs of PSAs treated under different temperature conditions. Scale bar: 1 cm. (b) 3D surface profiles before/after 60 °C treatment of 3 M PSA. (c) Surface roughness (Sa) of PSAs treated under different temperature conditions. (d) Photographs and SEM micrographs of 3 M PSA before/after 60 °C treatment. Scale bars: 500 μm.

