. 2024 Aug 23;15(11):3778–3794. doi: 10.1039/d4md00281d

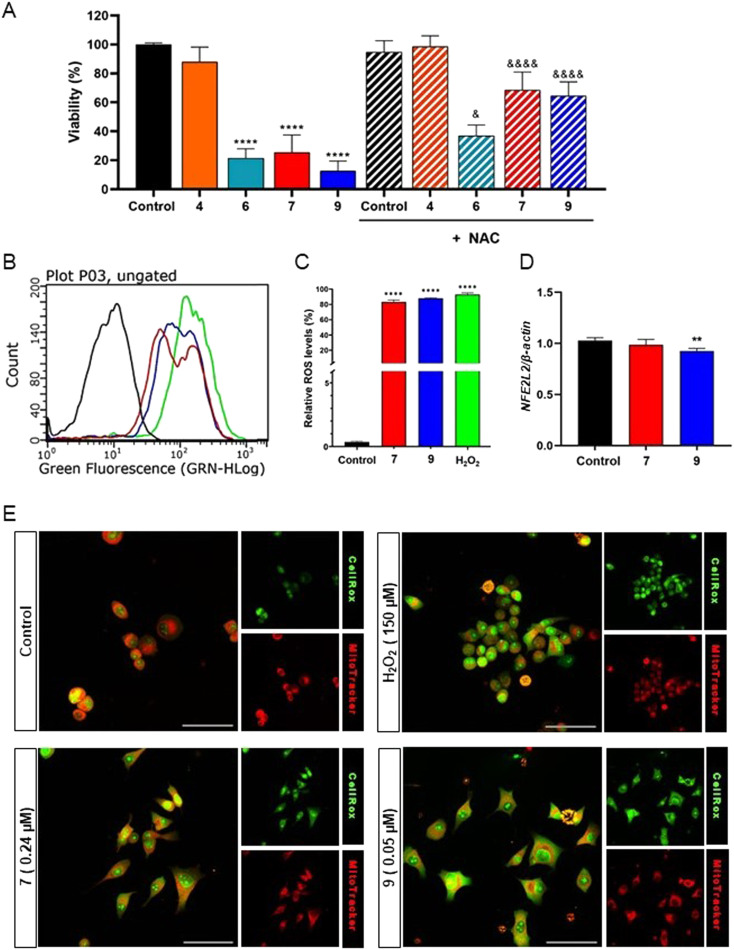
Fig. 6. (A) Cell viability determined by the sulforhodamine B (SRB) assay after 24 hours of treatment. PPT–furoxan hybrid 7 and its precursor hydroxyfuroxan 4 were tested at 0.24 μM, while PPT–furoxan hybrid 9 and its precursor 6 were tested at 0.05 μM. The DMSO group represents the negative control where cells were treated only with the vehicle (0.1% DMSO). The NAC group represents samples treated with N-acetyl-l-cysteine (NAC) at 1 mM. The treated samples in the absence of NAC were compared to the control group ****p < 0.0001 according to ANOVA followed by Tukey's post-test. The effects of hybrids 7 and 9 in the presence of NAC were compared to their precursors. &p < 0.05, &&&&p < 0.0001 according to ANOVA followed by Tukey's post-test. (B and C) Intracellular ROS production determined by flow cytometry, using CellROX Green®, after 30 minutes of treatment with PPT–furoxan hybrids 7 at 0.24 μM (red line) and 9 at 0.05 μM (blue line) in PC3 cells. DMSO (0.1% v/v) was used as a negative control (black line), and H2O2 was used as a positive control at 1 mM (green line). (D) Relative expression of NFE2L2 (NRF2) determined by qPCR after 3 h treatment with hybrids 7 and 9. The analyses were performed by comparing treated samples with control groups. ****p < 0.0001, ***p < 0.001, **p < 0.01 according to ANOVA followed by Tukey's post-test. (E) Confocal imaging of PC3 cells loaded with CellROX-Green® and MitoTracker Red® fluorescent probes. Scale bars: 50 μm.

Fig. 6