
Figure 4.
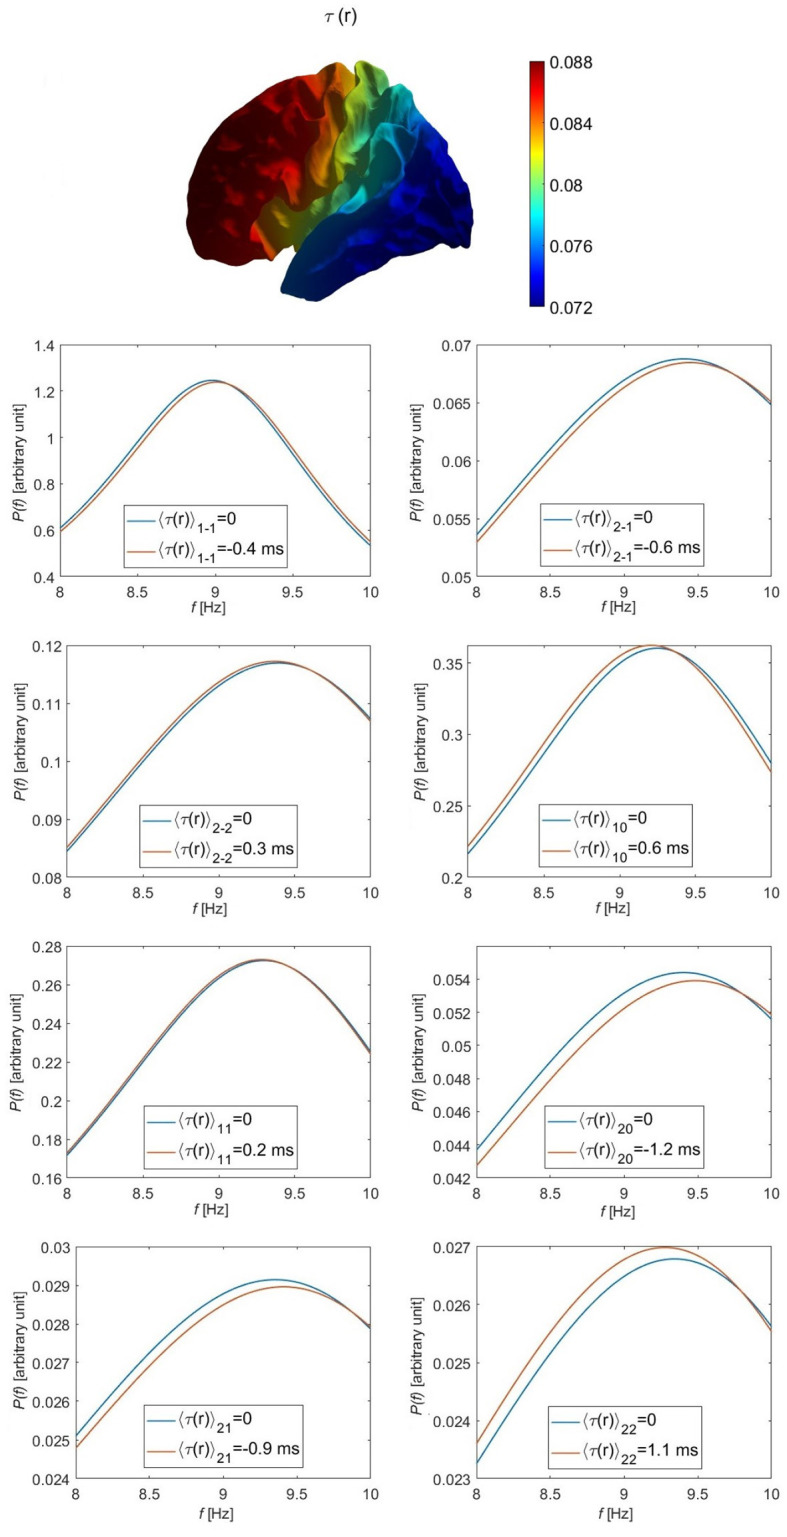
Individual modal spectra for the l = 1 and l = 2 eigenmodes, as labeled, including (red curves) and omitting (blue curves) the variation in the corticothalamic time delay τ for the parameters given in Table 1 and τ1max = 8 ms (there is no effect on the l = 0 mode). The top leftmost figure shows the variation in the assumed corticothalamic time delay over the cortical surface.