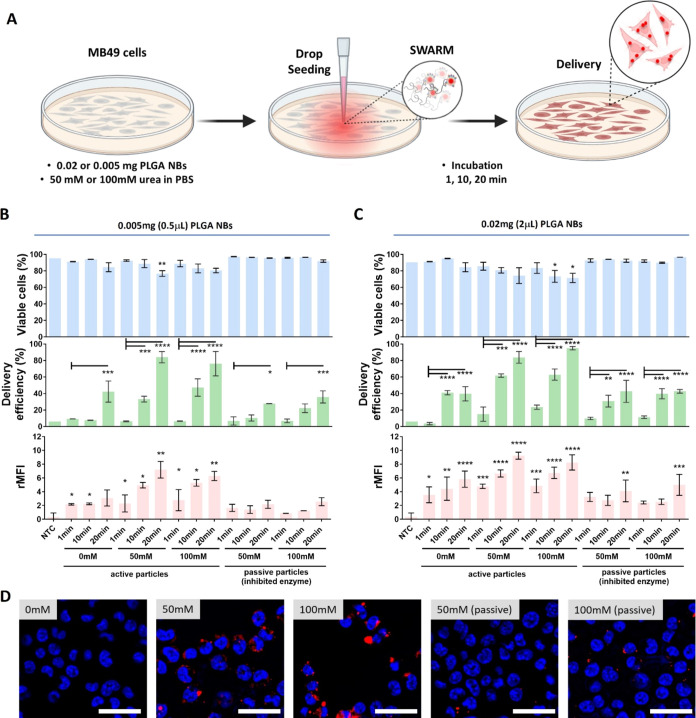
Figure 4.
Delivery by swarms of Cy5-labeled LBL PLGA NBs in MB49 cells (2D culture). (A) Schematic overview of the experimental design for the evaluation of the delivery efficiency of swarms of LBL PLGA NBs. For swarming effect evaluation: a drop of 0.5 μL containing 0.005 mg or 2 μL containing 0.02 mg of Cy5-labeled LBL PLGA NBs was added in the center of a dish previously seeded with MB49 cells and filled with 50 mM or 100 mM urea in PBS. After adding the drop, the system was left to evolve undisturbed for 1, 10, or 20 min prior to quantifying the delivery efficiency. Delivery efficiency (% positive cells for the presence of NBs—green bars) and relative mean fluorescence intensity per cell (rMFI—pink bars) were determined by flow cytometry for (B) 0.5 μL containing 0.005 mg of NBs or (C) 2 μL containing 0.02 mg of NBs. Cell viability was determined by CellTiter-Glo assay in parallel (blue bars). All results are represented as mean ± SD for n = 3 biologically independent samples. Statistical significance (one-way ANOVA, with and without multiple comparisons) is indicated when appropriate (*p < 0.05, **p < 0.01, ***p < 0.001, ****p < 0.0001). (D) Representative microscopy images of MB49 cells 20 min after treatment with 0.02 mg of active or inhibited NBs at different urea concentrations in PBS. Nuclei were stained with Hoechst 33342 (blue), while Cy5-labeled NBs are shown in red. The scale bar corresponds to 100 μm. Created with BioRender.com.

