Figure 5.
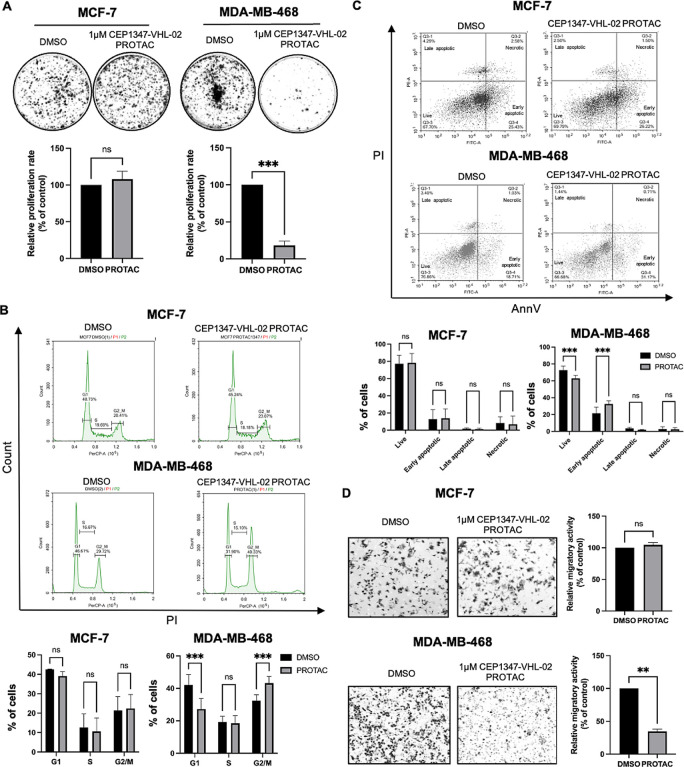
Degradation of endogenous MLK3 by the CEP1347-VHL-02 compound decreased the tumorigenic potential of MDA-MB-468 cells but not MCF-7 cells. (A) Colony formation assay of MCF-7 and MDA-MB-468 cell lines after CEP1347-VHL-02 PROTAC treatment. (Upper panel) Representative photographs of colonies stained with crystal violet formed by MCF-7 and MDA-MB-468 cells after 15 days of 1 μM CEP1347-VHL-02 PROTAC treatment. DMSO was used as a control. (Lower panel) Bar chart that summarizes data from three independent experiments. Each data point represents the mean ± standard deviation (SD) from three independent experiments. The statistical analysis was performed using an unpaired t-test (***p < 0.001) compared with control. (B) Cell cycle analysis in MCF-7 and MDA-MB-468 cell lines after CEP1347-VHL-02 PROTAC treatment. (Upper panel) Representative graphs of cell cycle analysis with propidium iodide staining in MCF-7 and MDA-MB-468 cell lines after 48 h of 1 μM CEP1347-VHL-02 PROTAC treatment. DMSO was used as a control. (Lower panel) Quantified data from two independent experiments. Each data point represents the mean ± SD from three independent experiments. The statistical analysis was performed using one-way ANOVA (***p < 0.001). (C) Cell viability analysis of MCF-7 and MDA-MB-468 cell lines after CEP1347-VHL-02 PROTAC treatment. (Upper panel) Representative graphs of cell viability analysis with annexin V and propidium iodide staining in MCF-7 and MDA-MB-468 cell lines after 48 h of 1 μM CEP1347-VHL-02 PROTAC treatment. DMSO was used as a control. (Lower panel) Quantified data from three independent experiments. Each data point represents the mean ± SD from three independent experiments. The statistical analysis was performed using one-way ANOVA (***p < 0.001). (D) Boyden chamber transwell migration assays of MCF-7 and MDA-MB-468 cell lines after CEP1347-VHL-02 PROTAC treatment. (Left panel) Representative images of a randomly selected area of MCF-7 and MDA-MB-468 cells that migrated through the membrane after 24 h of 1 μM CEP1347-VHL-02 PROTAC treatment. Cells were stained with crystal violet. (Right panel) Quantification of MCF-7 and MDA-MB-468 cells treated with 1 μM CEP1347-VHL-02 PROTAC and DMSO that migrated through the insert. The statistical analysis was performed using an unpaired t-test (**p < 0.01) compared with DMSO as a control. Standard error bars are shown.

