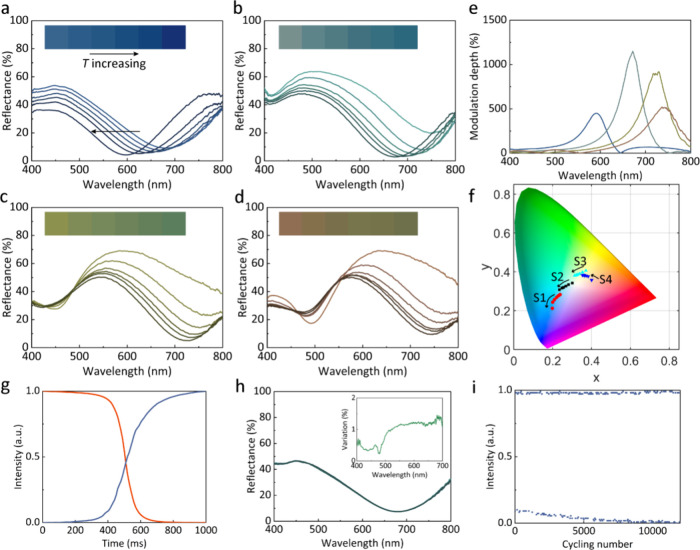
Figure 3.
(a–d) The reflectance of the fabricated filters as the temperature increases, as well as the optical images as inset. (e) The modulation depth for different filters. (f) The color change trace in the CIE 1931 diagram for the four filters. (g) The response time of the filters. (h) The reflective spectra of the filter at a chosen temperature measured for ten cycles.The inset shows the variation of the reflective spectra. (i) The durability of the VO2 filters.

