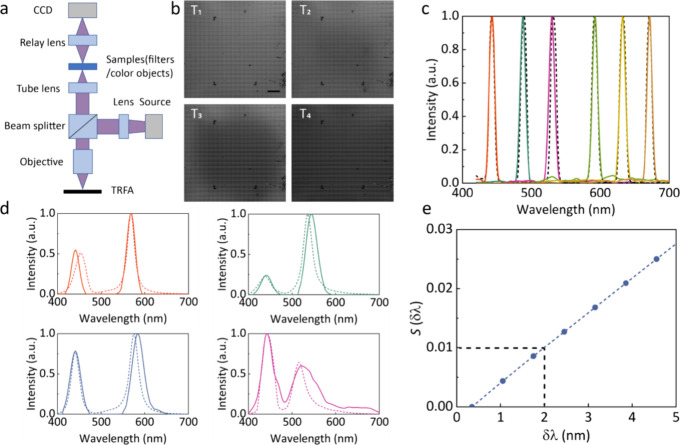
Figure 4.
(a) Setup for spectrum reconstruction. (b) Original B/W pictures for filters at different temperatures with an illumination wavelength of 600 nm. (c, d) Reference (dashed lines) and recovered (solid lines) spectra for both the narrowband and broadband input signals. (e) Calculated S(δλ) used to estimate the spectral resolution of our system. Scale bar: 200 μm in (b).

