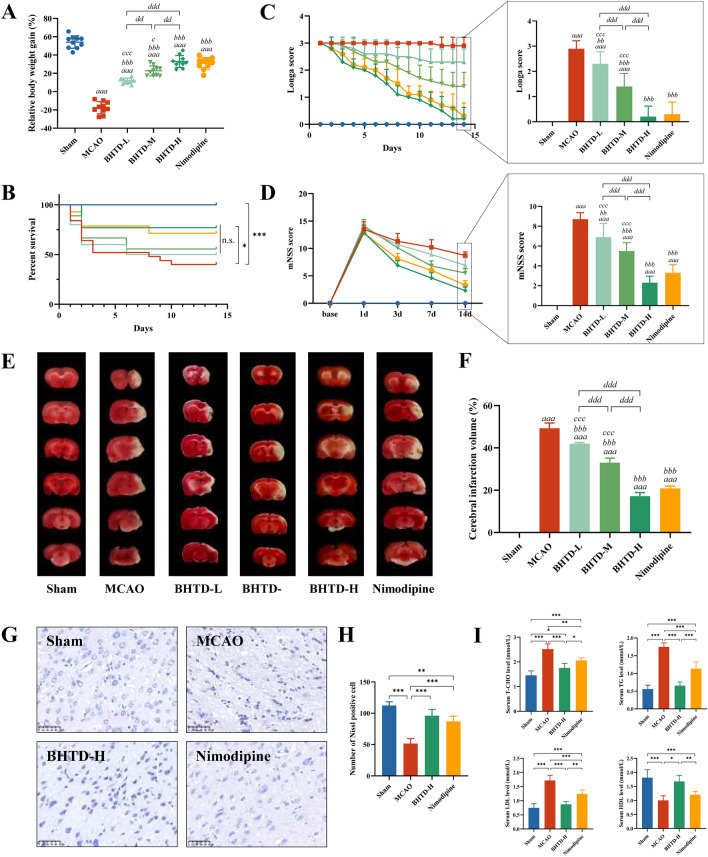
Fig. 1.
BHTD ameliorated neurological function, reduced infarct volume and improved dyslipidemia. A Relative body weight gain for 14 days. B Survival curve. C Longa score. D mNSS score. (A–D, n = 10) E Representative images of TTC staining. F Quantitative analysis of cerebral infarct areas (n = 4). G Representative images of Nissl staining (scale bar = 50 µm). H Quantification of the Nissl staining (n = 4). I Blood lipid in serum: T-CHO, TG, LDL and HDL (n = 6). All data are shown as mean ± SD. For A–D, aP < 0.05, aaP < 0.01 and aaaP < 0.001, vs the Sham group; bP < 0.05, bbP < 0.01 and bbbP < 0.001, vs the MCAO group; cP < 0.05, ccP < 0.01 and cccP < 0.001, vs the Nimodipine group; dP < 0.05, ddP < 0.01 and dddP < 0.001, compared in three BHTD groups. For E–I, *P < 0.05, **P < 0.01, ***P < 0.001

