Fig. 6.
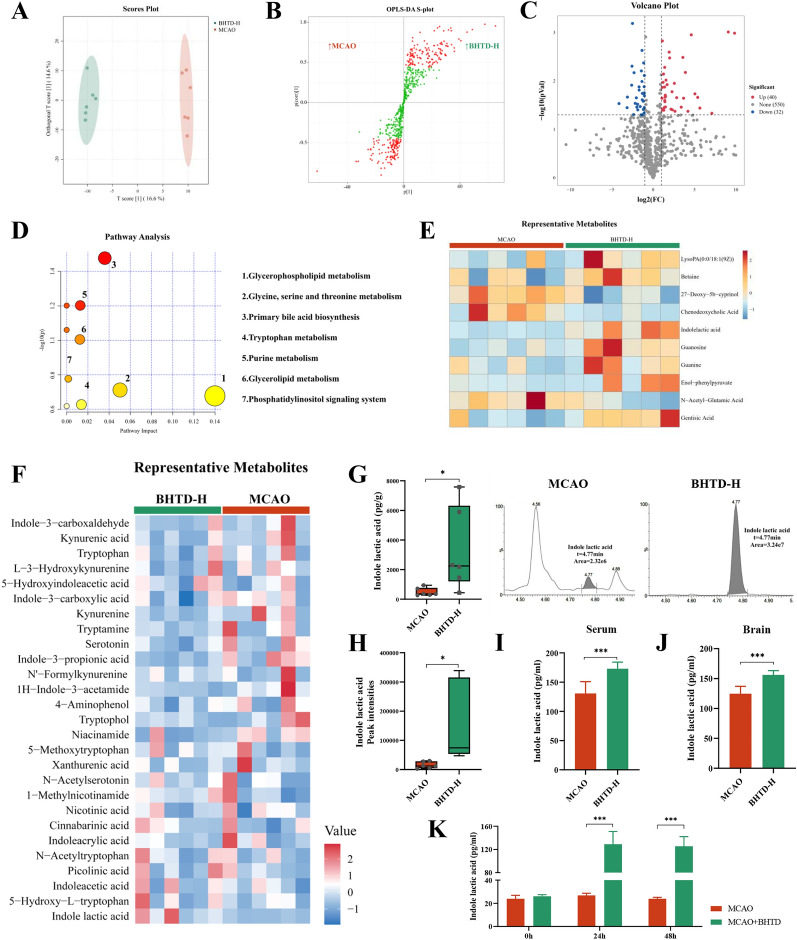
BHTD upregulated tryptophan metabolism in the gut microbiota to promote the production of indole lactic acid. A OPLS-DA plot (n = 6). B S-plot analysis. C Volcano plot. D Pathway analysis based on KEGG database. E–F Heatmap of metabolites. G The levels of ILA in the cecal contents (n = 6) and representative chromatogram. H The peak intensities of ILA (n = 6). I, J The levels of ILA in the serum and brain (n = 6). K The levels of ILA in the in vitro fermentation assay (n = 6). All data are shown as mean ± SD. *P < 0.05, **P < 0.01, ***P < 0.001

