. 2024 Sep 16;26(37):24524–24532. doi: 10.1039/d4cp02542c

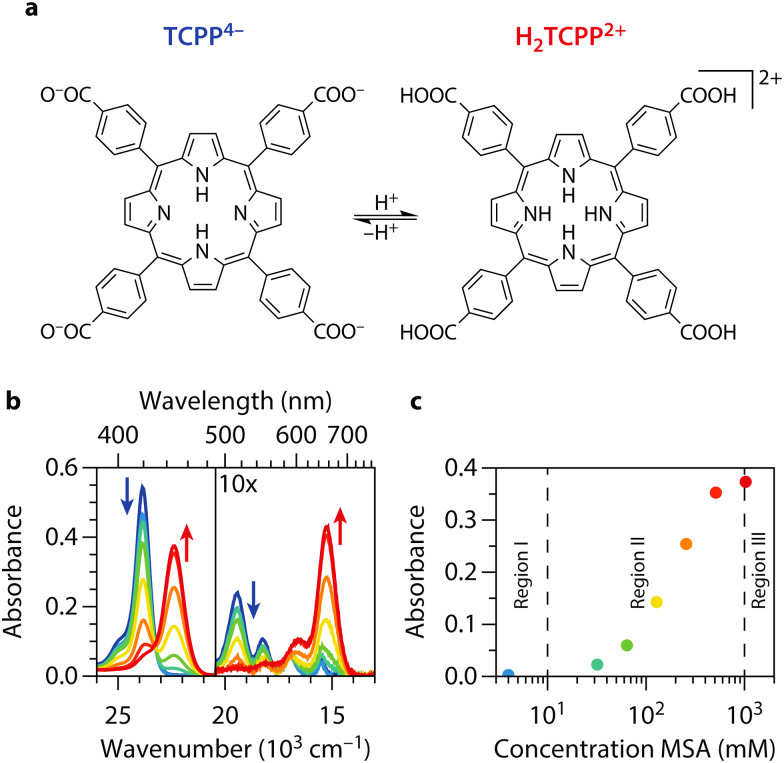
Fig. 1. Steady-state absorption spectroscopy of TCPP and H 2 TCPP 2+ . (a) Molecular structure of carboxylate-form of tetrakis(4-carboxyphenyl)-porphyrin and its fully protonated diacid (TCPP4− and H2TCPP2+). (b) UV/vis spectra of 1.26 μM TCPP4− in DMF at different acid concentrations from blue to red (0, 4, 32, 64, 128, 256, 512, and 1024 mM MSA). The Soret band (S0 to S2 transition) is located at 23.9 × 103 cm−1 (419 nm) for TCPP and at 22.4 × 103 cm−1 (446 nm) for H2TCPP2+. The region with the four Q-bands of the porphyrin (lower energy section of the plot) is zoomed in 10 times for visualization purposes. H2TCPP2+ only shows two Q-bands for reasons discussed in the text. (c) Absorbance at 22.4 × 103 cm−1, a direct measure to the amount of H2TCPP2+, as function of MSA concentration. We indicate three regions, neutral (I), intermediately protonated (II), and fully protonated (III).

Fig. 1