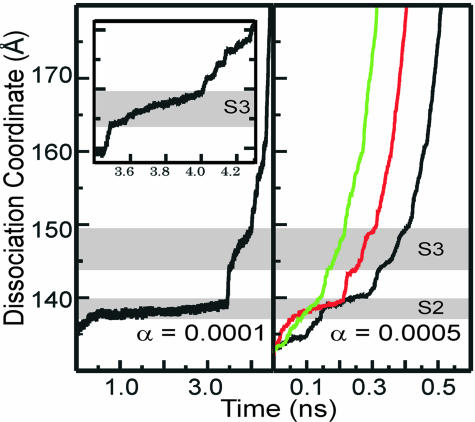
Fig. 4.
The time profile of dissociation coordinate (ρ0.5) for the biased simulations, with α = 0.0001 kcal/mol·Å4 (Left) and 0.0005 kcal/mol·Å4 (Right). S2 is the region of simulation for ρ0.5 from 137 to 140 Å and corresponding time from 0.3 to 3.4 ns, and S3 is the region of simulation for ρ0.5 from 144 to 150 Å and corresponding time from 3.5 to 4.1 ns. (Inset) Enlarged part of Left between 3.4 and 4.3 ps.

