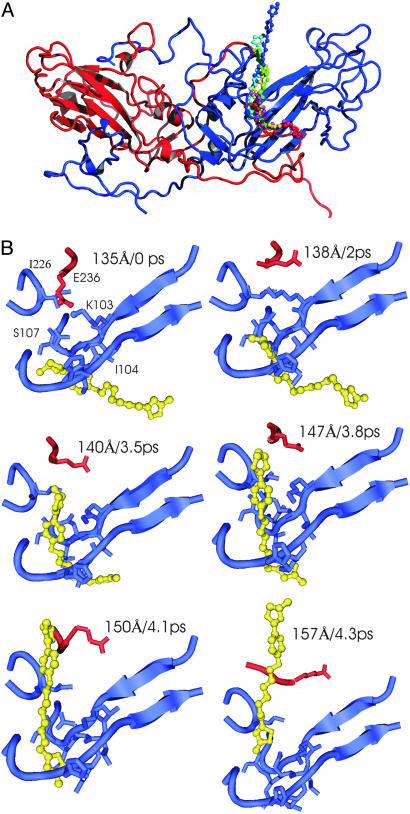
Fig. 6.
WIN 52084 dissociation pathway. (A) The pathway illustrated with overlaid snapshots of WIN 52084 and a single copy of VP1 (blue) and VP3 (red). (B) Individual snapshots illustrating dissociation for α = 0.0001 kcal/mol·Å4. Each panel is labeled with the dissociation coordinate ρ0.5 (Å) and simulation time (ps) corresponding to the profile in Fig. 4 Left. Blue, VP1 residues 98–107, 220–222, and 265–267; red, VP3 residues 232–235; yellow, WIN 52064.

