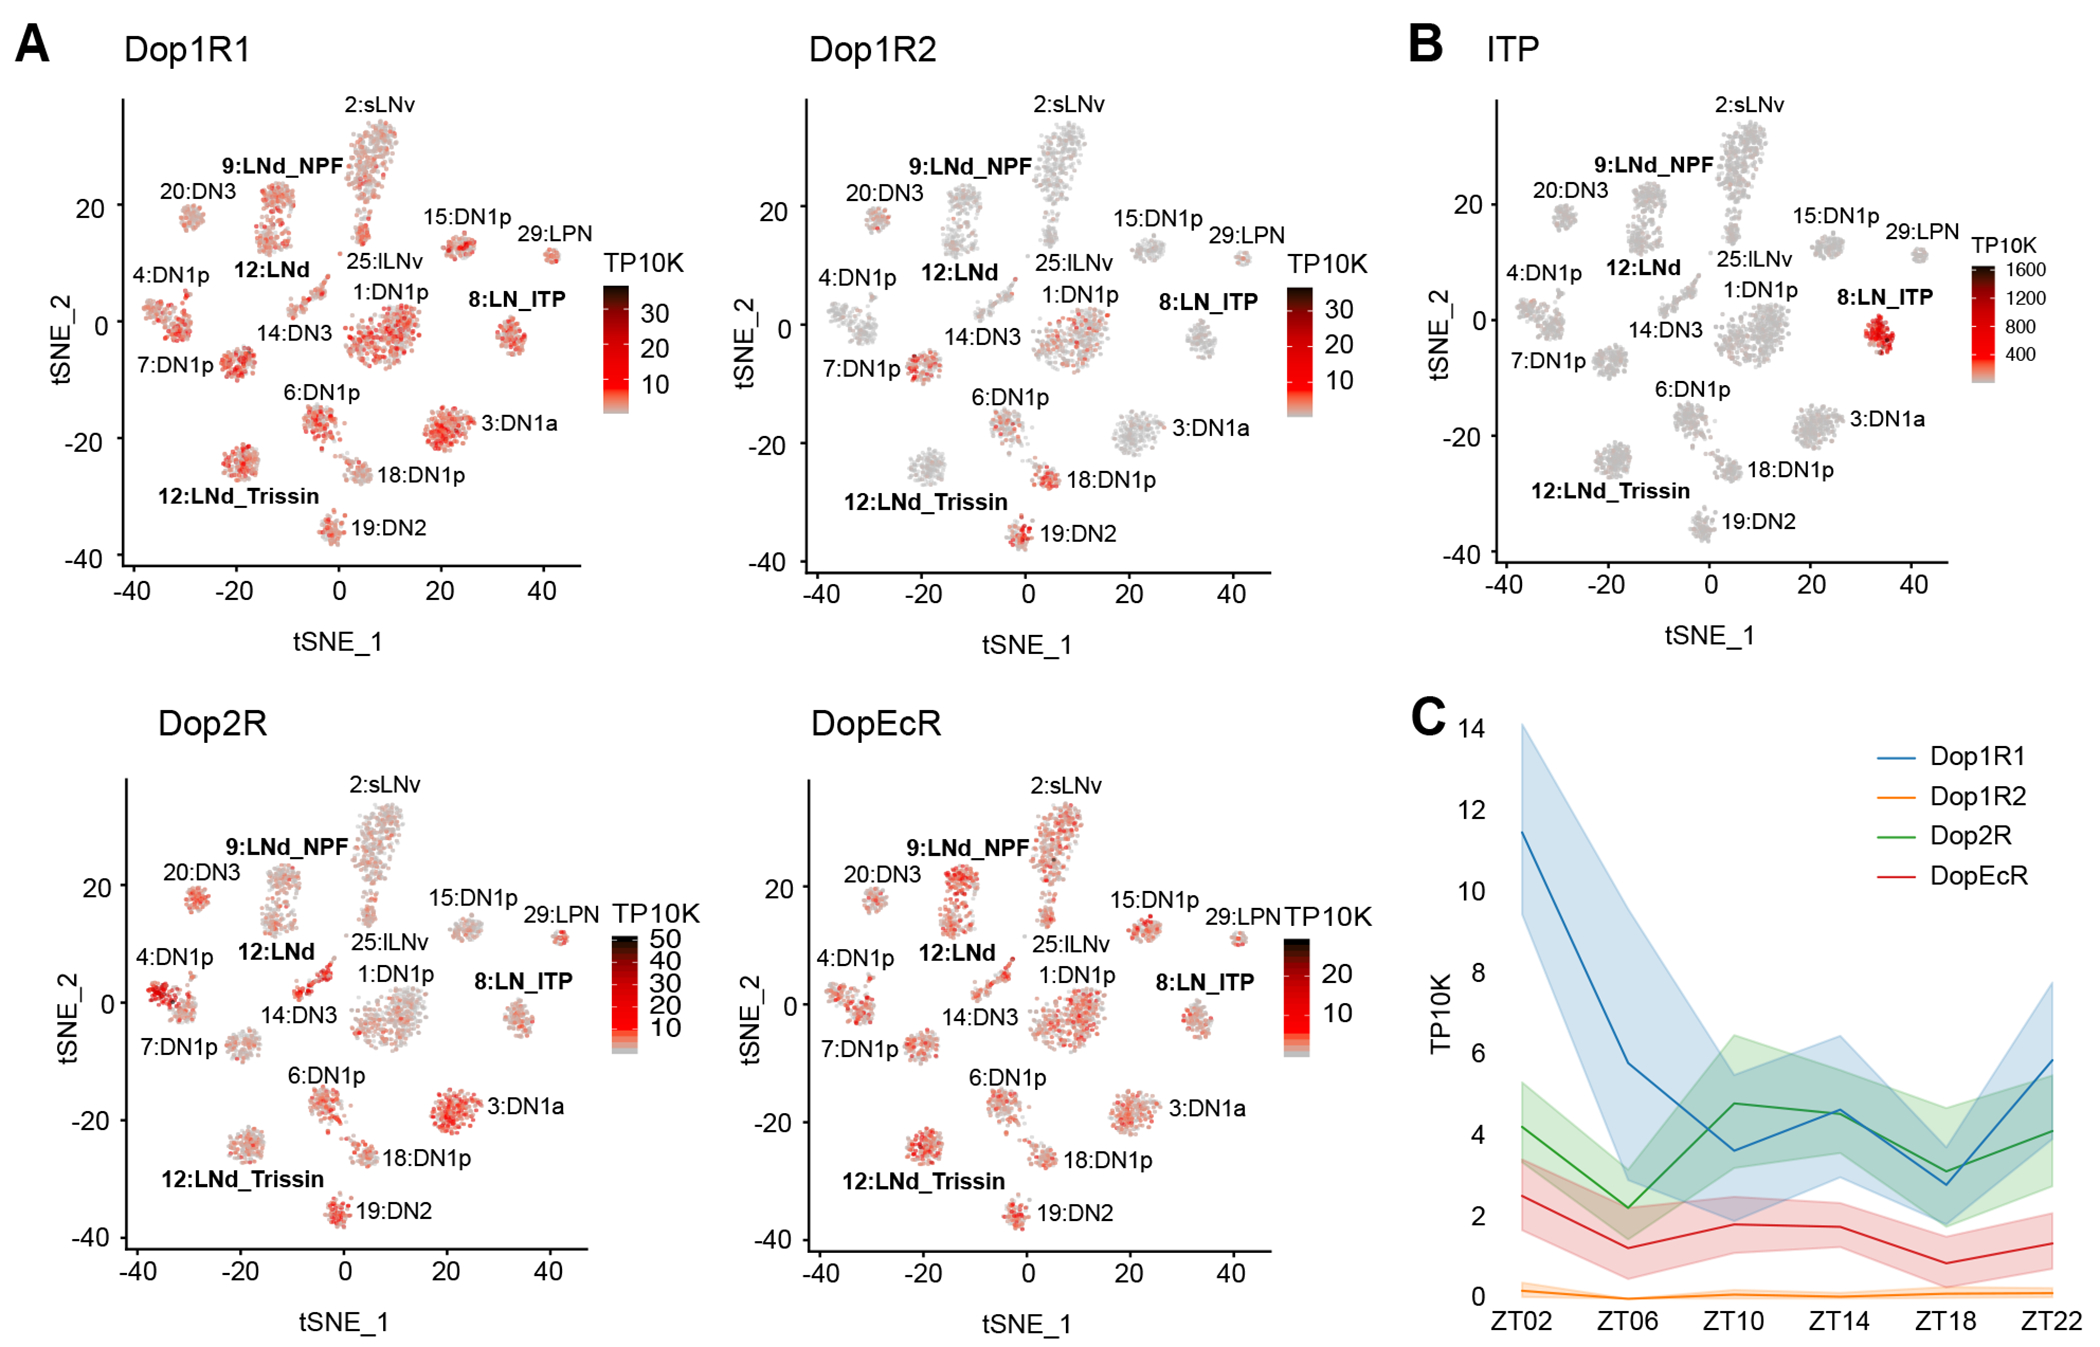
Figure 4. ITP+ LNs highly express Dop1R1 mRNA.

(A) Single-cell RNA sequencing data of circadian neurons 4 displayed as tSNE plots and shaded by levels of dopamine receptor mRNA expression in number of transcripts per ten thousand transcripts. Each dot represents a single cell and each cluster represents a cell-type. Evening cell clusters marked by bold text.
(B) Single-cell RNA sequencing data of circadian neurons 4 displayed as a tSNE plot and shaded by levels of ITP mRNA expression in number of transcripts per ten thousand transcripts. Each dot represents a single cell and each cluster represents a cell-type. Evening cell clusters marked by bold text.
(C) Timeseries plot of dopamine receptor mRNA expression levels around the clock in ITP+ LNs in number of transcripts per ten thousand transcripts. Different colors represent different dopamine receptors mRNAs. Bold lines are means and shaded regions are 95% confidence intervals of the means.
See also Figure S4.
