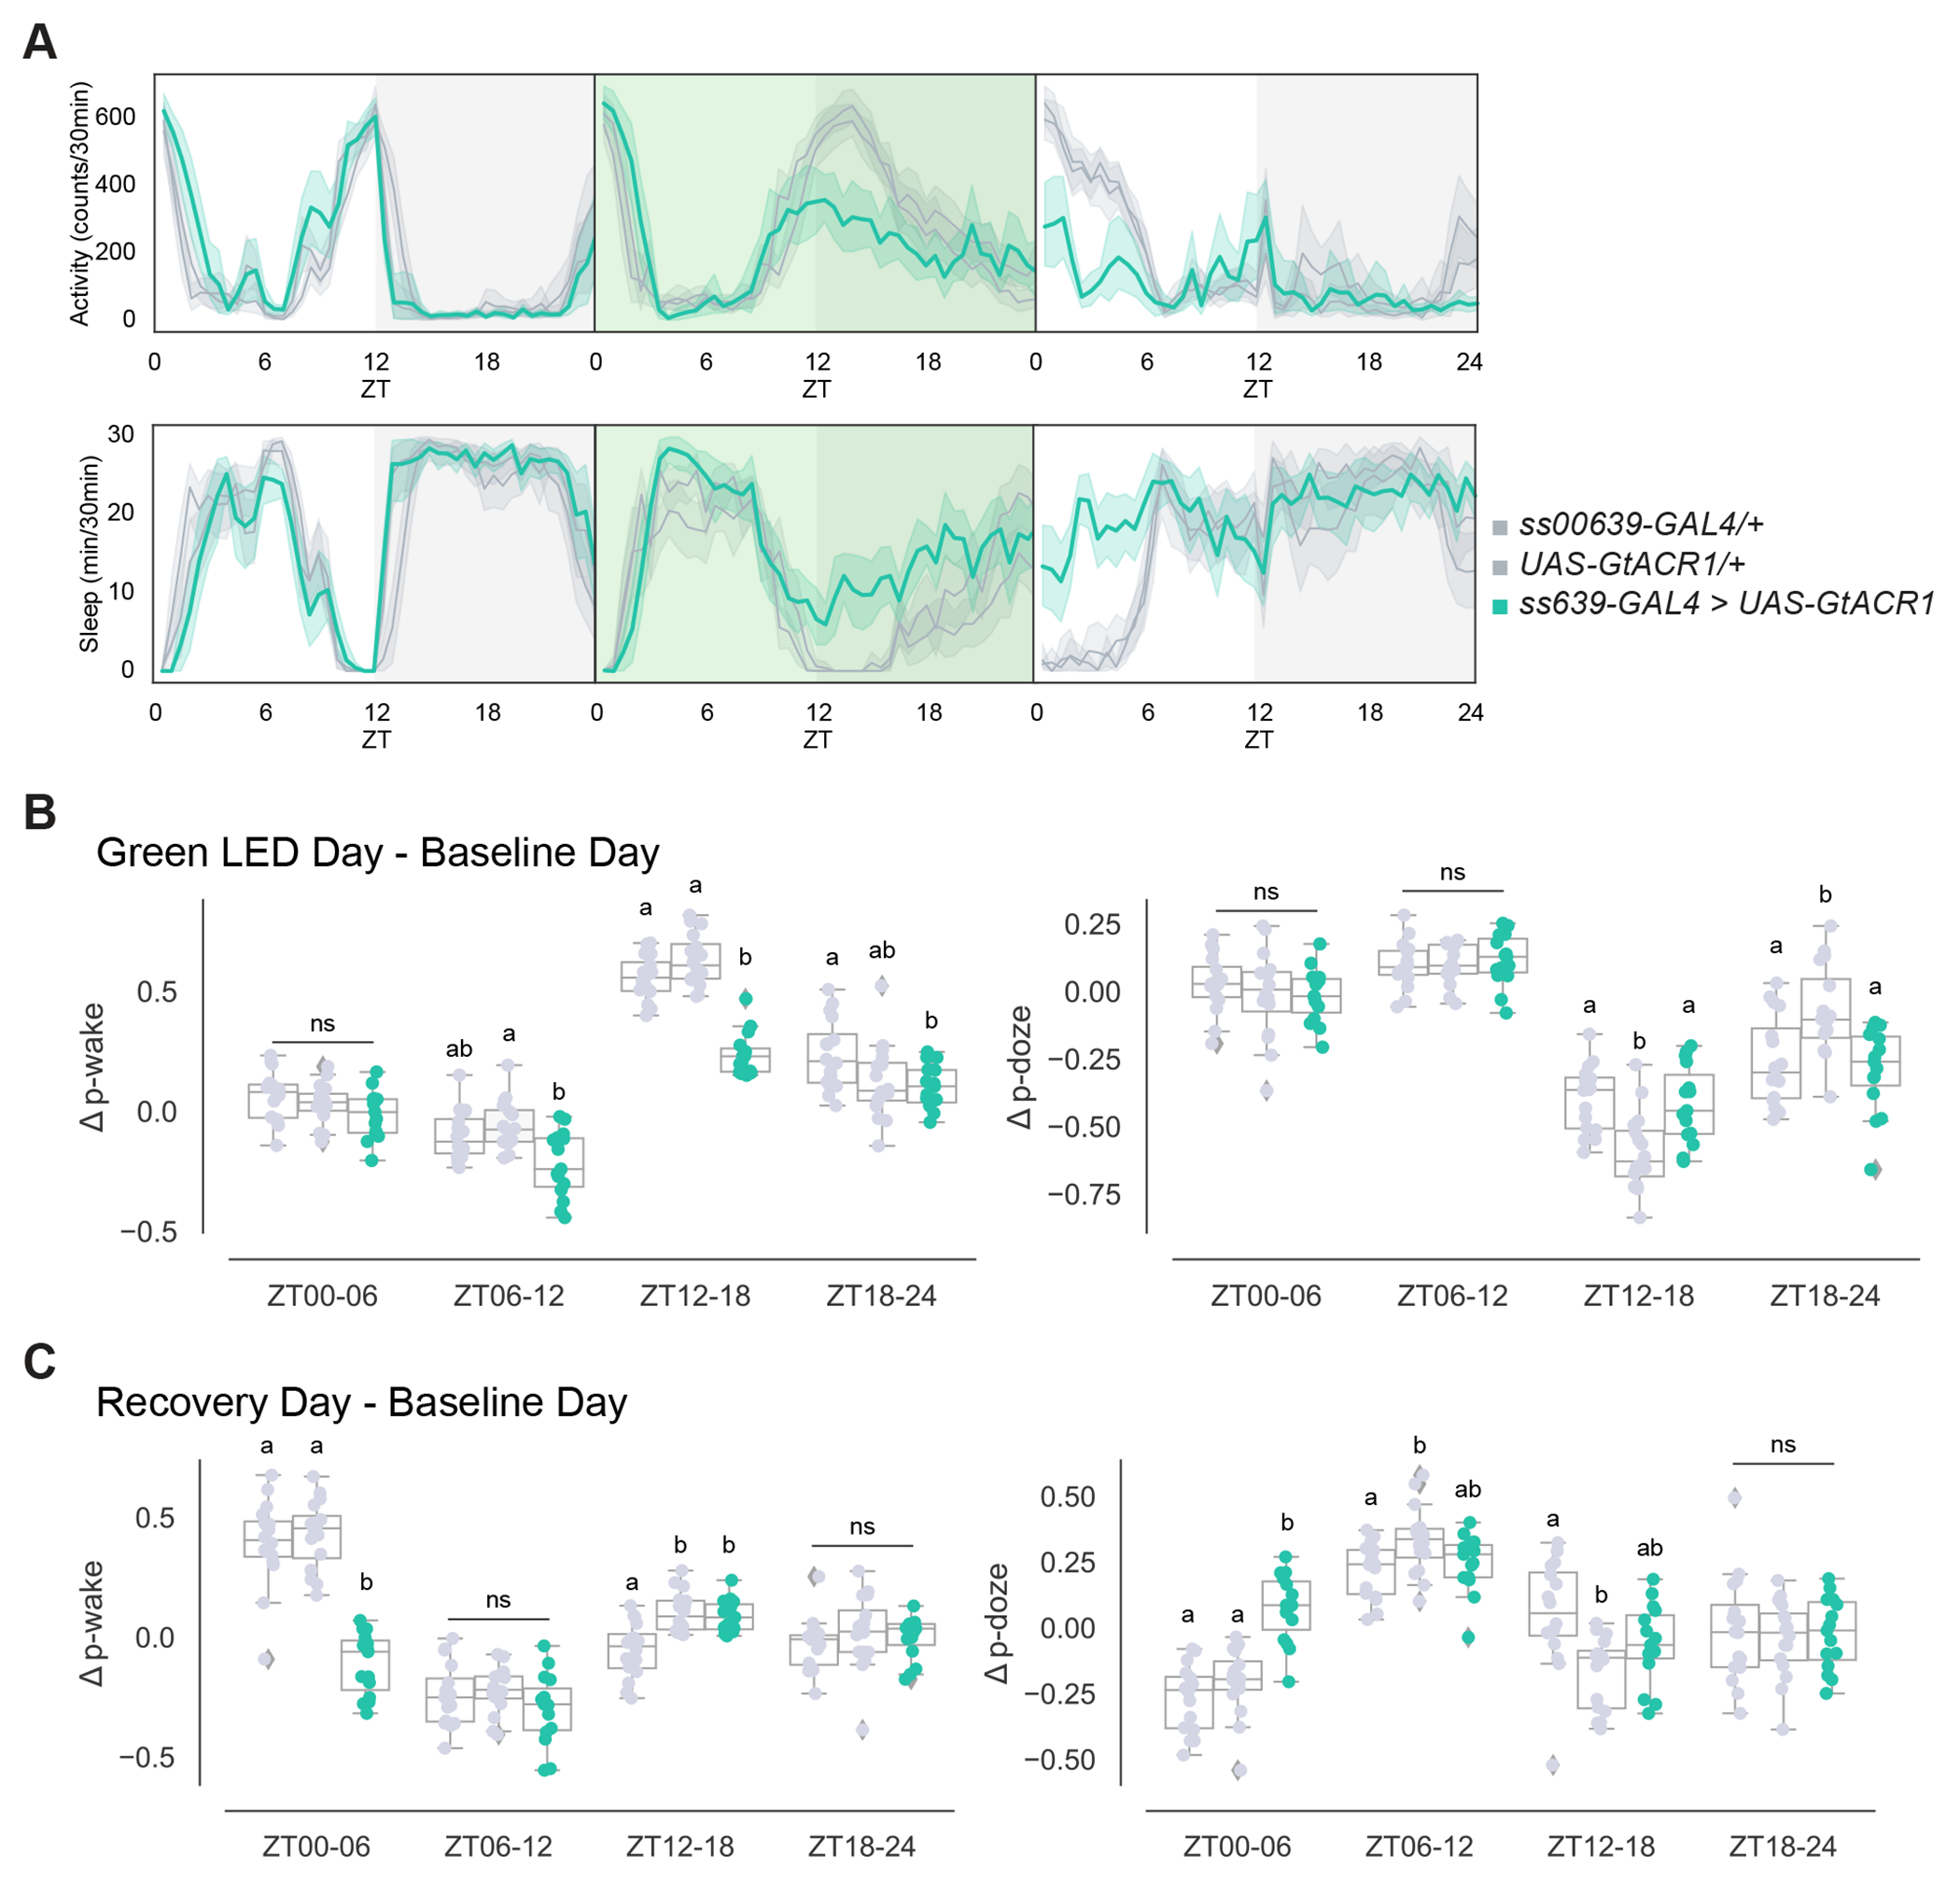
Figure 7. Acute inhibition of ITP+ LNs leads to decreased morning wakefulness in the subsequent day.

(A) Timeseries plots of activity and sleep of male flies expressing green light-sensitive GtACR1 in ITP+ LNs at baseline (left), with 24-hour red LED optogenetic activation (middle), and during recovery (right) in 12:12 LD. Heterozygous ss00639-GAL4 (n=16) and UAS-GtACR1 (n=16) controls are in gray. Experimental flies (n=16) expressing both transgenes are colored. Bold lines are means and shaded regions are 95% confidence intervals of the means.
(B) Boxplots quantifying the change in p-wake (left) and p-doze (right) of male flies expressing green light-sensitive GtACR1 in ITP+ LNs during the green LED optogenetic activation day from baseline day in six-hour time bins. Genotypes are depicted by the same color scheme as in (A). Letters represent statistically distinct groups as tested by a Kruskal Wallis test, post-hoc Mann Whitney U multiple comparisons method, and a Bonferroni-corrected significance value of p < 0.01667. Groups labeled with “ns” are not statistically distinct.
(C) Boxplots quantifying the change in p-wake (left) and p-doze (right) of male flies expressing green light-sensitive GtACR1 in ITP+ LNs during the recovery day from baseline day in six-hour time bins. Genotypes are depicted by the same color scheme as in (A). Letters represent statistically distinct groups as tested by a Kruskal Wallis test, post-hoc Mann Whitney U multiple comparisons method, and a Bonferroni-corrected significance value of p < 0.01667. Groups labeled with “ns” are not statistically distinct.
