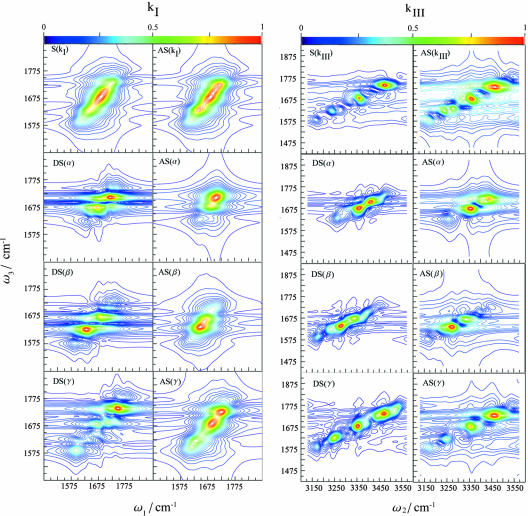
Fig. 2.
Two-dimensional coherent vibrational spectra of TB6. (Left) Sensitivity analysis for kI. In the left column is shown the total simulated spectrum S(kI) and its derivatives with respect to the various secondary structures, DS(α), DS(β), and DS(γ). In the right column is shown the additive spectrum obtained by neglecting inter secondary structure couplings AS(kI), and the contributions of each motifs to the spectrum [AS(α), AS(β), and AS(γ)]. (Right) Sensitivity analysis for kIII.In the left column is shown the total simulated spectrum S(kIII) and its derivatives with respect to the various secondary structures, DS(α), DS(β), and DS(γ). In the right column is shown the additive spectrum obtained by neglecting inter secondary structure couplings, AS(kIII), and the contributions of each motifs to the spectrum [AS(α), AS(β), and AS(γ)].

