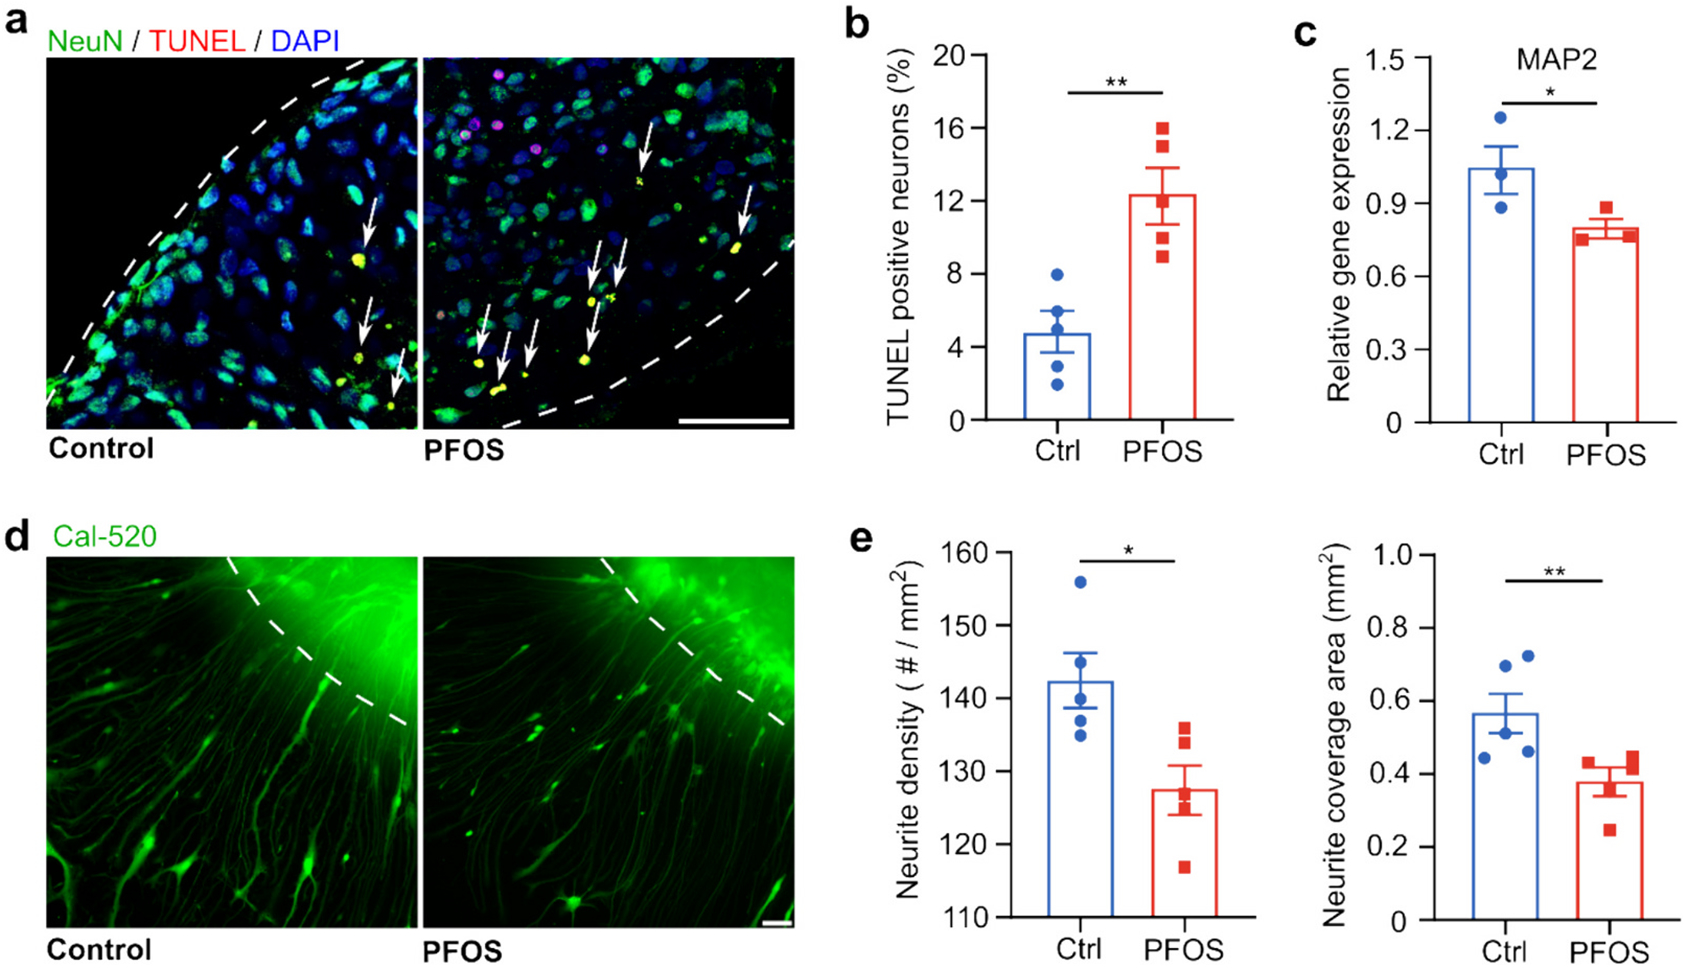
Fig. 5.

PFOS causes neuronal apoptosis and reduces neurite density. Immunofluorescent staining of neuronal apoptosis (TUNEL, NeuN, and DAPI) in two-month-old hMOs (a) and the corresponding quantification (b) after a 7-day exposure in control group (vehicle) and PFOS group (300 μM) (mean ± s.e.m., unpaired t-test, n = 5 organoids, from 3 independent experiments). (c) qPCR analysis of relative MAP2 gene expression after a 7-day exposure in control group (vehicle treated with 0.05 % DMSO) and PFOS group (300 μM) (mean ± s.e.m., unpaired t-test, n = 3 organoids, from 3 independent experiments). Fluorescent images of neurites of two-month-old hMOs (d) and quantification of neurite density and coverage area (e) after a 7-day exposure in control group (vehicle treated with 0.05 % DMSO) and PFOS group (300 μM) (mean ± s.e.m., unpaired t-test, n = 5 organoids, from 3 independent experiments). White dashed lines: the boundary of hMOs. Scale bar: 50 μm.
