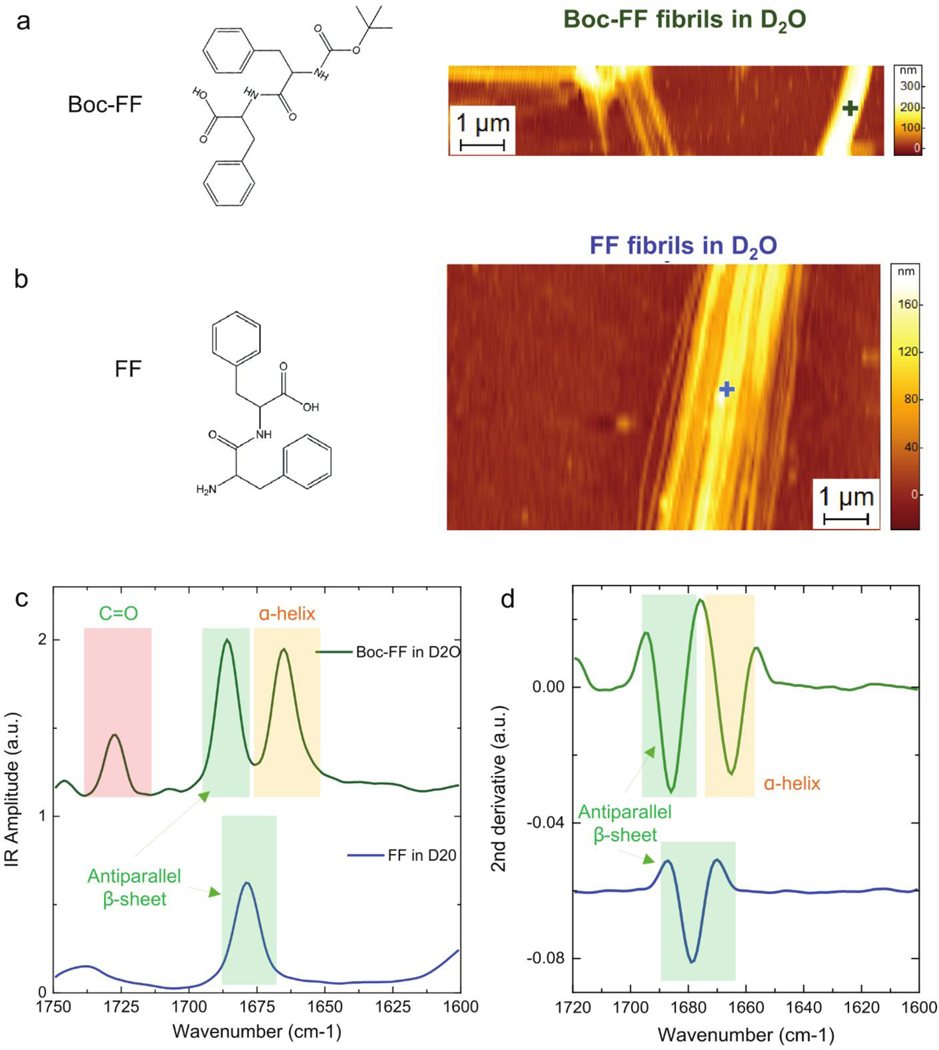
Figure 4. PTIR structural comparison of FF and Boc-FF fibrils in D2O.
Chemical structure and AFM morphology map of a) Boc-FF and b) FF fibrils. c) Comparison of the fibrils average PTIR spectra in the Amide I (green and yellow) and C=O stretching vibration (red) spectral ranges. The + symbols mark the locations of the individually acquired spectra, reported in SI Fig. 2–3. d) Comparison of the second derivatives spectra in the Amide band I region.

