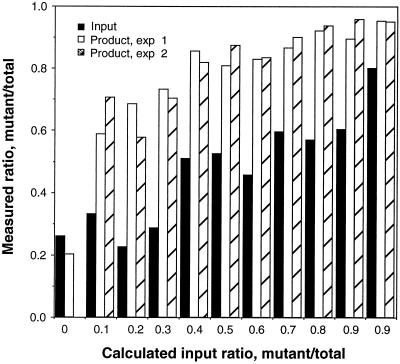
FIG. 5.
Competitive integration-PCR assay. AL-31/32, representing the ASLV U3 WT substrate, was mixed with AL-41/42, whose sequence is identical to AL-31/32 except for a single-nucleotide change from T to A at position 4. The mixture were subjected to a single round of integration and PCR amplification. The PCR products and initial substrate mixture pool were sequenced on a 20% sequencing gel. The relative amounts of A and T at position 4, representing the two integrated substrates, were determined by phosphorimage analysis. The x axis shows the ratio of the substrates added to the reaction mixture. The solid bars represent the value of A/(A+T) of the initial substrate mixture, determined by sequencing the pool prior to the integration-PCR assay. The first solid bar is a background value since there is no selected substrate. The shaded bars are values of A/(A+T) in the integration-PCR products from duplicate experiments.

