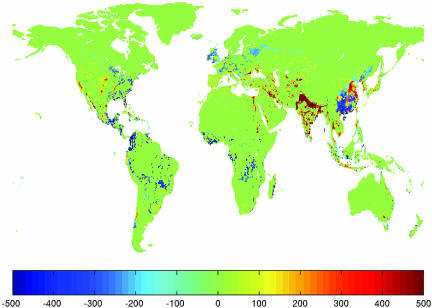
Fig. 4.
Spatial distribution of net changes in vapor flows between potential vegetation and actual deforested and irrigated vegetation in mm/yr. The aggregated global change as compared with the potential vegetation is small (400 km3/yr), but the map illustrates the large spatial redistribution of water vapor flows from the land surface at the global scale.

