Fig. 1.
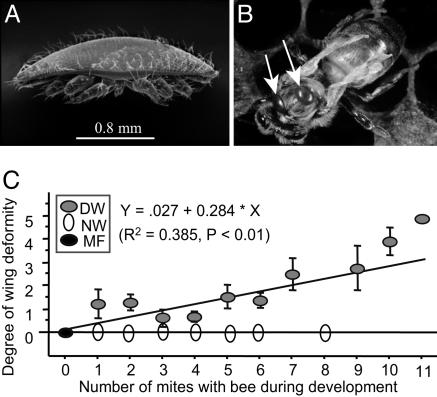
The relationship between bee wing deformity and the density of varroa mites. (A) A scanning electron microscope photograph of a female varroa mite. (B) A newly emerged worker bee with a typical symptom of deformed wings with two mites on her thorax as the white arrows indicate. (C) Linear regression analysis for the relationship between the degree of wing deformity and the number of mites per cell (mean ± SEM). Three groups of newly emerged worker bees were distinguished: DW, NW, and MF. (A is used with the permission of Scott Camazine; B is used with the permission of Maryann Frazier.)

