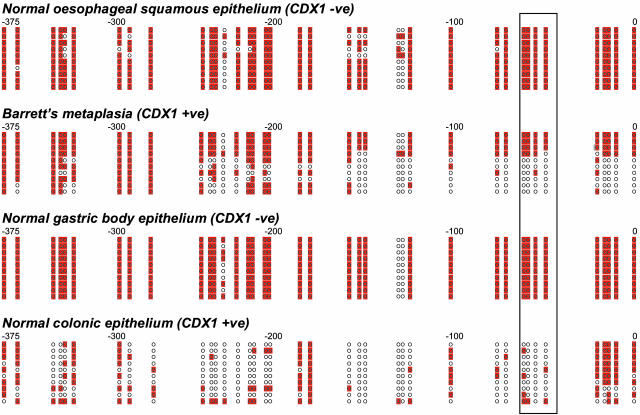
Fig. 2.
CDX1 promoter bisulfite sequencing of normal esophageal squamous epithelium, BM, normal gastric body epithelium, and normal colonic epithelium. For each tissue sample, relative location and methylation status of CDX1 promoter CpGs for 10 clones are shown. Each circle represents a CpG, and base positions relative to the CDX1 transcription start site are shown above each cluster of clones. Methylated CpGs are shaded. CpGs enclosed by the box (positions –53 to –65) represent those suggested to be crucial for transcriptional control (16).

