. 2024 Sep 10;20(1):2389606. doi: 10.1080/21645515.2024.2389606
© 2024 Merck & Co., Inc., Rahway, NJ, USA. Published with license by Taylor & Francis Group, LLC.
This is an Open Access article distributed under the terms of the Creative Commons Attribution-NonCommercial License (http://creativecommons.org/licenses/by-nc/4.0/), which permits unrestricted non-commercial use, distribution, and reproduction in any medium, provided the original work is properly cited. The terms on which this article has been published allow the posting of the Accepted Manuscript in a repository by the author(s) or with their consent.
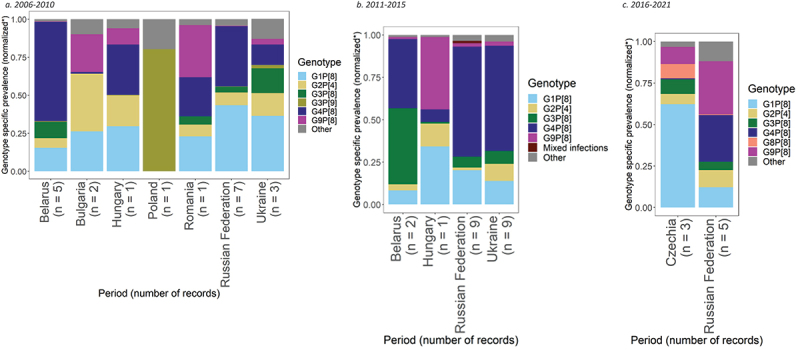
Figure 2.

Prevalence of the most common rotavirus genotypes in Eastern Europe.
