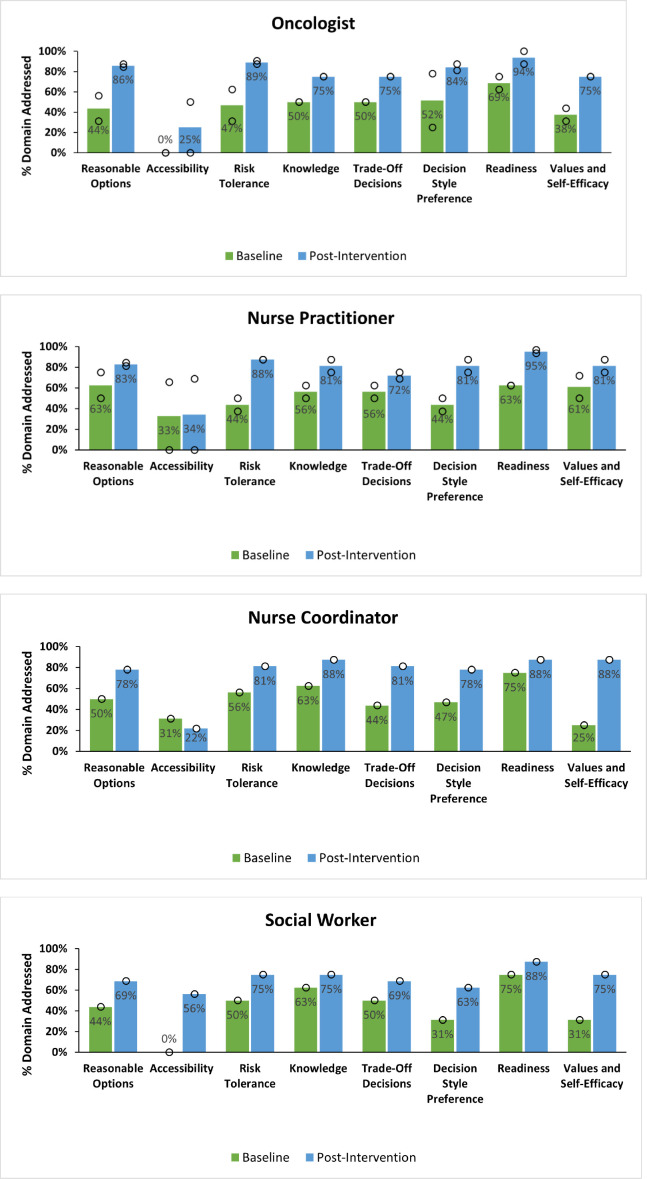
Figure 2:
Percentage of improvement seen by profession/specialty for all domains. Green = preintervention; blue = postintervention. Circles denote performance values in the distribution contributing to each average (bar). Oncologists, n = 2; nurse practitioners, n = 2; nurse coordinator, n = 1; social worker, n = 1.

