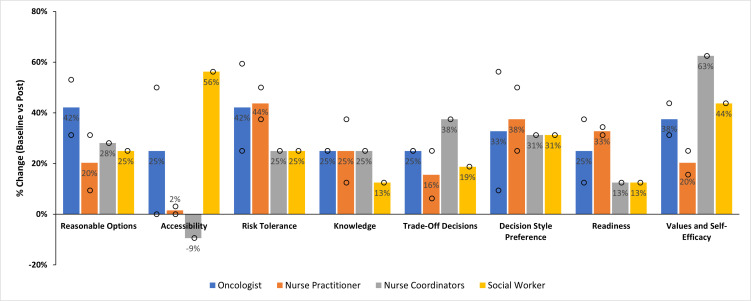
Figure 3:
Baseline vs post change by profession/specialty: Bars denote the average percentage of change in each domain by profession/specialty. Blue = oncologist, orange = nurse practitioner, gray = nurse coordinators, and yellow = social worker. Circles denote individual performance values in the distribution contributing to each average (bar). Domains are defined as Awareness (reasonable options, accessibility), Assessment (risk tolerance, knowledge, trade-off decisions), and Activation (readiness, values, and self-efficacy).

