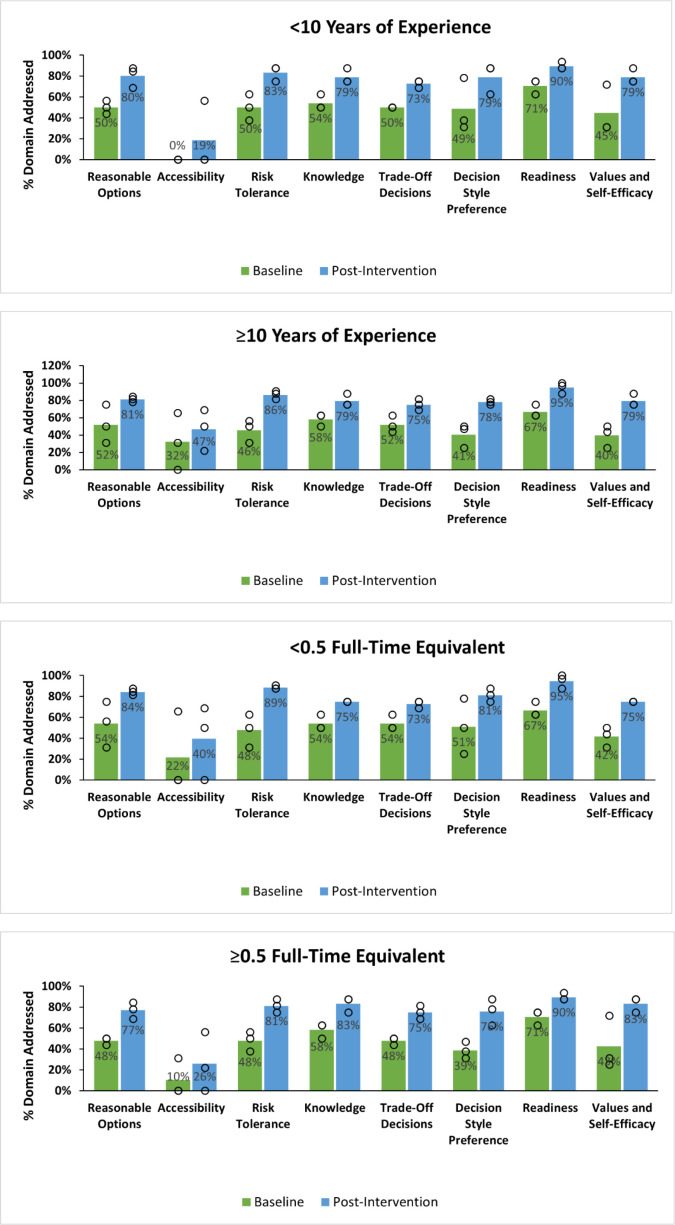
Figure 4:
Pre- and postprogram changes by years of experience and FTE (N = 6). Bars denote the average percentage mastery of each performance domain for program participants (green = preprogram exposure; blue = postprogram exposure). Circles denote performance values in the distribution contributing to each average (bar). < 10 years of experience, n = 3; ≥ 10 years of experience, n = 3. < 0.5 FTE, n = 3; ≥ 0.5 FTE, n = 3. FTE = full-time equivalent.

