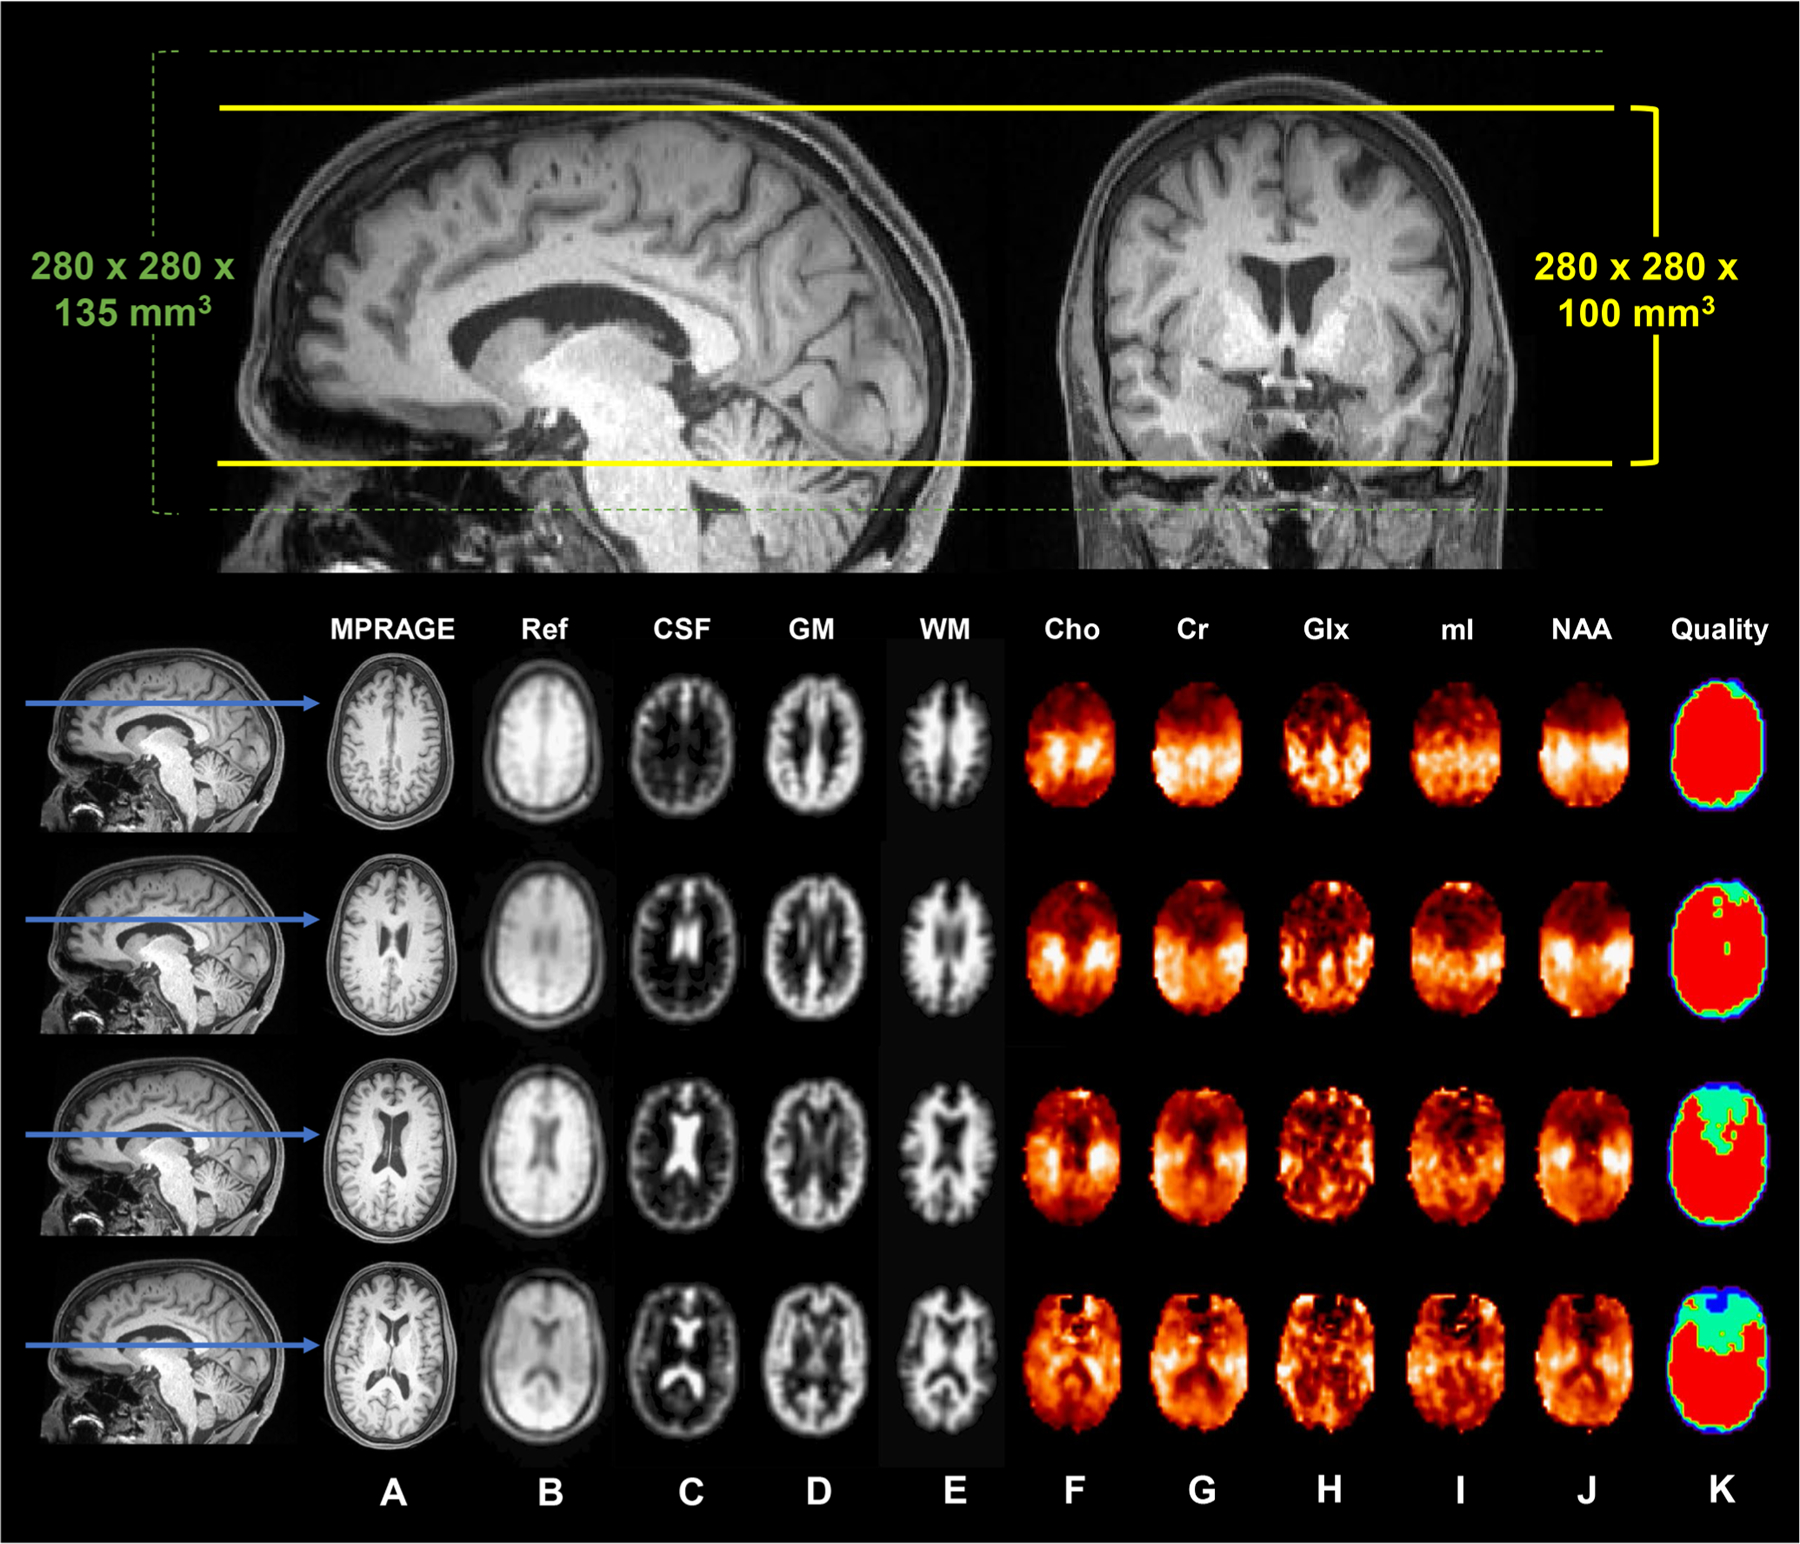
Fig. 2. 1H MRSI of the whole brain.

Top: Reconstructed sagittal and coronal T1-weighted MPRAGE images from a single subject. The 280 × 280 × 135 mm3 (left-right x anterior-posterior x inferior-superior) field-of-view is superimposed (dotted green lines), along with the 280 × 280 × 100 mm3 excitation slab (solid yellow lines). Bottom: Four reconstructed axial T1-weighted MPRAGE images (A) and their indicated positions along the sagittal plane (blue arrows). Shown in (B) is the water reference image, used for image registration, B0- and eddy-current correction, and signal normalization; (C-E) are the segmented tissue maps of cerebrospinal fluid (CSF), gray matter (GM), and white matter (WM), down-sampled to the MRSI resolution; (F-J) are the metabolite maps of choline (Cho), creatine (Cr), glutamate-plus-glutamine (Glx), myo-inositol (mI), and N-acetyl-aspartate (NAA); and (K) is the quality map, in which red indicates voxels that fulfilled all quality criteria, including metabolite linewidth <12 Hz and signal <3 standard deviations from the mean.
