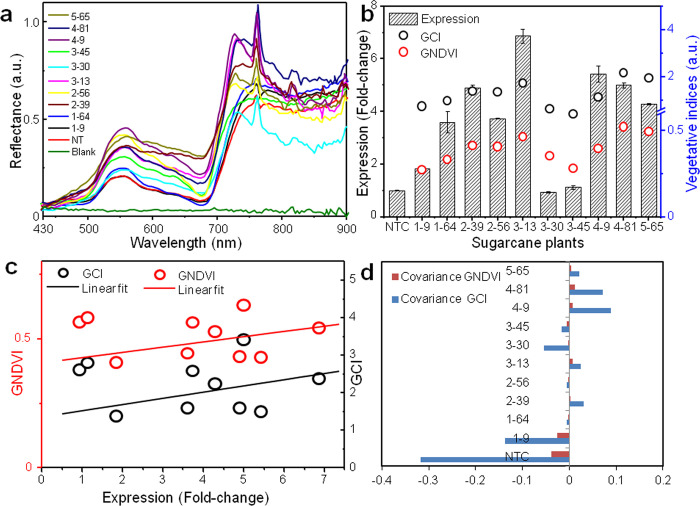
Fig 2. Hyperspectral imaging of transgenic sugarcane leaves.
(a) Leaf reflectance spectra. (b) Double Y-plot of vegetative indices as a function of fold-change in endochitinase expression. The bars represent mean standard error.(c) Relationship between change in transgene expression and vegetative indices as determined by Pearson’s correlation coefficient. (d) Covariance plot of transgenic sugarcane plants against vegetative indices.

