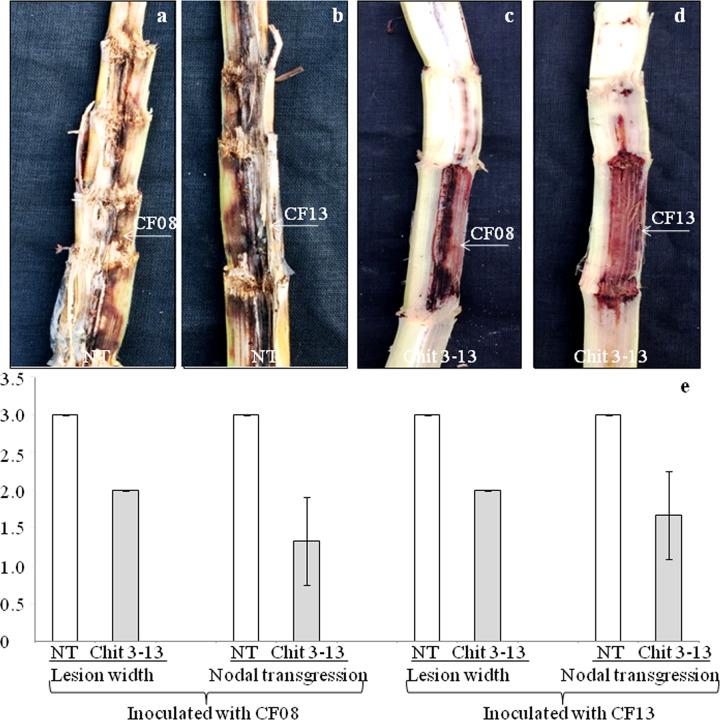
Fig 3. Bioassay for red rot incidence.
(a)Non-transgenic plant showing susceptibility after inoculation with CF08. (b) Non-transgenic plant inoculated with CF13 revealing highly susceptible. (c) Transgenic plant Chit 3–13 inoculated with CF08 displaying resistance. (d) Transgenic plant Chit 3–13 inoculated with CF13 showing resistance. Arrows indicates point of inoculation. (e) Graphical representation of disease symptoms. The bars represent mean standard error.

